2024-04-12tidyods and shrthnd are on r-universe

At some point I’ll probably get round to putting {tidyods} and {shrthnd}
on CRAN, but in the meantime I’ve set up a repository on
R-universe that hosts these two packages.
2024-04-11Introducing shrthnd

About a year ago I started development of a new R package to deal with dirty data, specifically to process the use of shorthand, symbols and other annotations in columns of spreadsheets and tables. I realised I’ve not blogged about it, and thus if one subscribes to “blog-driven-development”1 then if I’ve not blogged about it the package doesn’t exist.
2023-06-15How do you solve a problem like govukhugo?

I created govukhugo in my last
couple of years working for the Cabinet Office’s Analysis & Insight Team. But
in July last year I left that role, and government. But I’m aware, via
sources1, there have been some requests within government for updates,
including support for Quarto. So I’ve thought a bit about where next for the
project2. This post has turned out to be a bit of a stream of
consciousness/potted history of the development of govukhugo, so there’s
also a TLDR summary if you want to skip to the end.
2023-06-08Using Quarto and {officer} for semi-automating PowerPoint slides
I’m working on a project where one of the outputs is a deck of Microsoft
PowerPoint slides that act as a reference guide1. Outside of contents,
introductory and annex slides the bulk of the slides follow the same format
with a simple table providing metadata about a suite of around 90 indicators.
Using the gtcars dataset
I’ll demonstrate how I’ve used Quarto and the
{officer} package to automate some
of the workflow.
2023-05-01Refactoring and improving {tidyods}
Last summer I started
the development of {tidyods}, an
R package for reading cells in ODS (OpenDocument Spreadsheet) files, and
effectively a {tidyxl} equivalent for
ODS files. After developing the first iteration of the package in June I left
it alone, but I’ve recently revisited the package and refactored the code which
has improved performance.
2023-04-15Beep... boop... boot, booting the narrowbotr off Twitter
Back in November after the various developments with Twitter, I worked out how to get my Twitter bot to run on Mastodon. Since the Twitter takeover there have been various announcements from the new owner and official Twitter accounts about free access to the Twitter API being suspended, although these have usually come and gone without said suspension happening.
2023-02-21New year... new me?
Yeah, ok, it’s late February, so a bit late for a “new year, new me” declaration, but I’ve been feeling like I should write a little something about… *waves hands in a generalised and unspecified fashion*. So this is a relatively short post about leaving the civil service last year, what I’ve done since and what I’m thinking about for the future.
2022-11-14Switching the narrowbotr to Mastodon

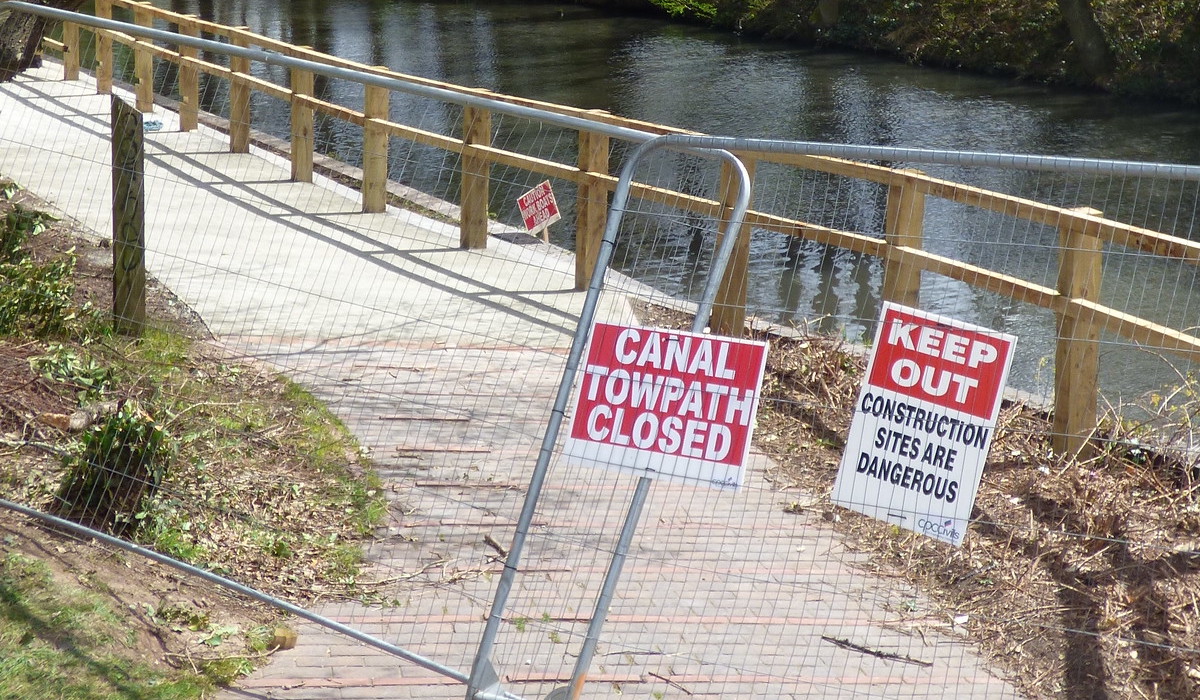
Two years and one month ago to the day I blogged about setting up the narrowbotr, a Twitter bot that randomly posts locations on the inland waterways network in England & Wales managed by Canal & River Trust. What with everything going on with Twitter at the moment I’ve set myself up on Mastodon, where I’m @mattkerlogue@fosstodon.org, and so why not also migrate the narrowbotr.
Setting up an account
There’s more than enough posts and whatnot out there about moving to Mastodon/the fediverse, Danielle Navarro’s blog is particularly good. Long story short, there are a lot of different Mastodon instances out there, with slightly different focus and audience.
2022-08-31Calculating energy costs

Energy costs in the UK, and globally, have been rising significantly as a result of Russia’s invasion of Ukraine. Energy prices for domestic (i.e. residential/household) consumers in the UK have been subject to a “cap”1 calculated by the energy regulator, Ofgem. The price cap is usually quoted in terms of it’s annual value, which possibly isn’t the most useful approach, especially as we head into the winter months. So I tried to estimate what my energy costs might be… and then I turned that exercise into an interactive calculator that others can use.
2022-06-12Introducing tidyods

TLDR: For very good reasons ODS is a horrible data file format.
The OpenDocument Spreadsheet (ODS) format is an increasingly common format for publishing spreadsheets, especially official statistics from UK government departments. I recently encountered a problem when trying to use the {readODS} package to read a published ODS file. More surprsingly, I discovered that {readODS} is the only R package on CRAN for working with ODS files. As a result I’ve started to develop my own package, {tidyods}.
2021-05-12How much is that meeting in the window?

No matter what job we do or who we work for all of us have been in meetings that we knew weren’t worth it. For those of us in the public sector there’s the added pressure knowing that we’re paid by the taxpayer. A couple of weeks ago a friend who works in another government department (for arguments sake the Department for Action) was lamenting that they and their team of six were asked by a someone in another government department (let’s say the Ministry of Meetings) to have a meeting with their team about a joint project they were working on. Come the time of the meeting my friend in DfA and her team all signed on to the virtual meeting, 10-15 minutes go by and none of the folk from MoM turn up. Not only is this wasted time, but time also means money, and in this case public money.
2021-01-17Making aRt
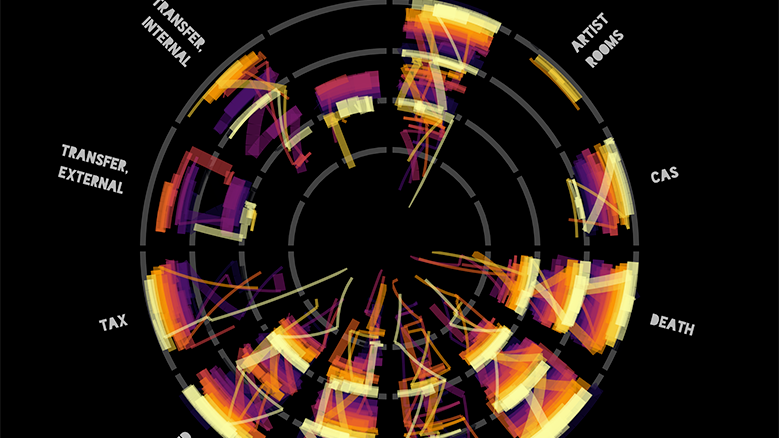
One of my 2021 resolutions was to engage with Tidy Tuesday more often. I’ve dabbled in the past but never recorded my work or published it. This week’s data was a catalogue of the Tate collection, and there have been some rather fantastic visualisations, no doubt inspired by the fact the subject matter is art.
The other week I saw a tweet by Ijeamaka Anyene showcasing some fabulous artistic plots made in R by using the coord_polar() function within {ggplot2}. So I’ve had art on my mind recently and seeing the outputs of this week’s Tidy Tuesday working with the Tate collection reminded me that I had promised to engage with Tidy Tuesday more routinely.
2021-01-10Planning our Twitter walk

Let’s just acknowledge upfront that this is a very strange week to be writing about Twitter posting strategies1.
This is the second blog about my coastalwalkr project, you can read the first here. The last post introduced a conceptual evolutionary jump for the mapbotverse — walking — and we’ve seen how in R we might be able to programmatically take a walk along the coast of Great Britain. For humans the walk in and of itself can be the sole purpose of the activity, but a mapbot probably needs something more to keep itself occupied and entertained? Most folk when heading out on a walk will plan their route in advance, and the coast can definitely be somewhere where a route plan is a good idea2. So we should be responsible mapbot walkers3, and come up with a plan for our walk4. This post explores what a strategy for tweeting along our mapbot’s walk might include based on potential data/sources that we might use.
2021-01-03Let's go for a walk
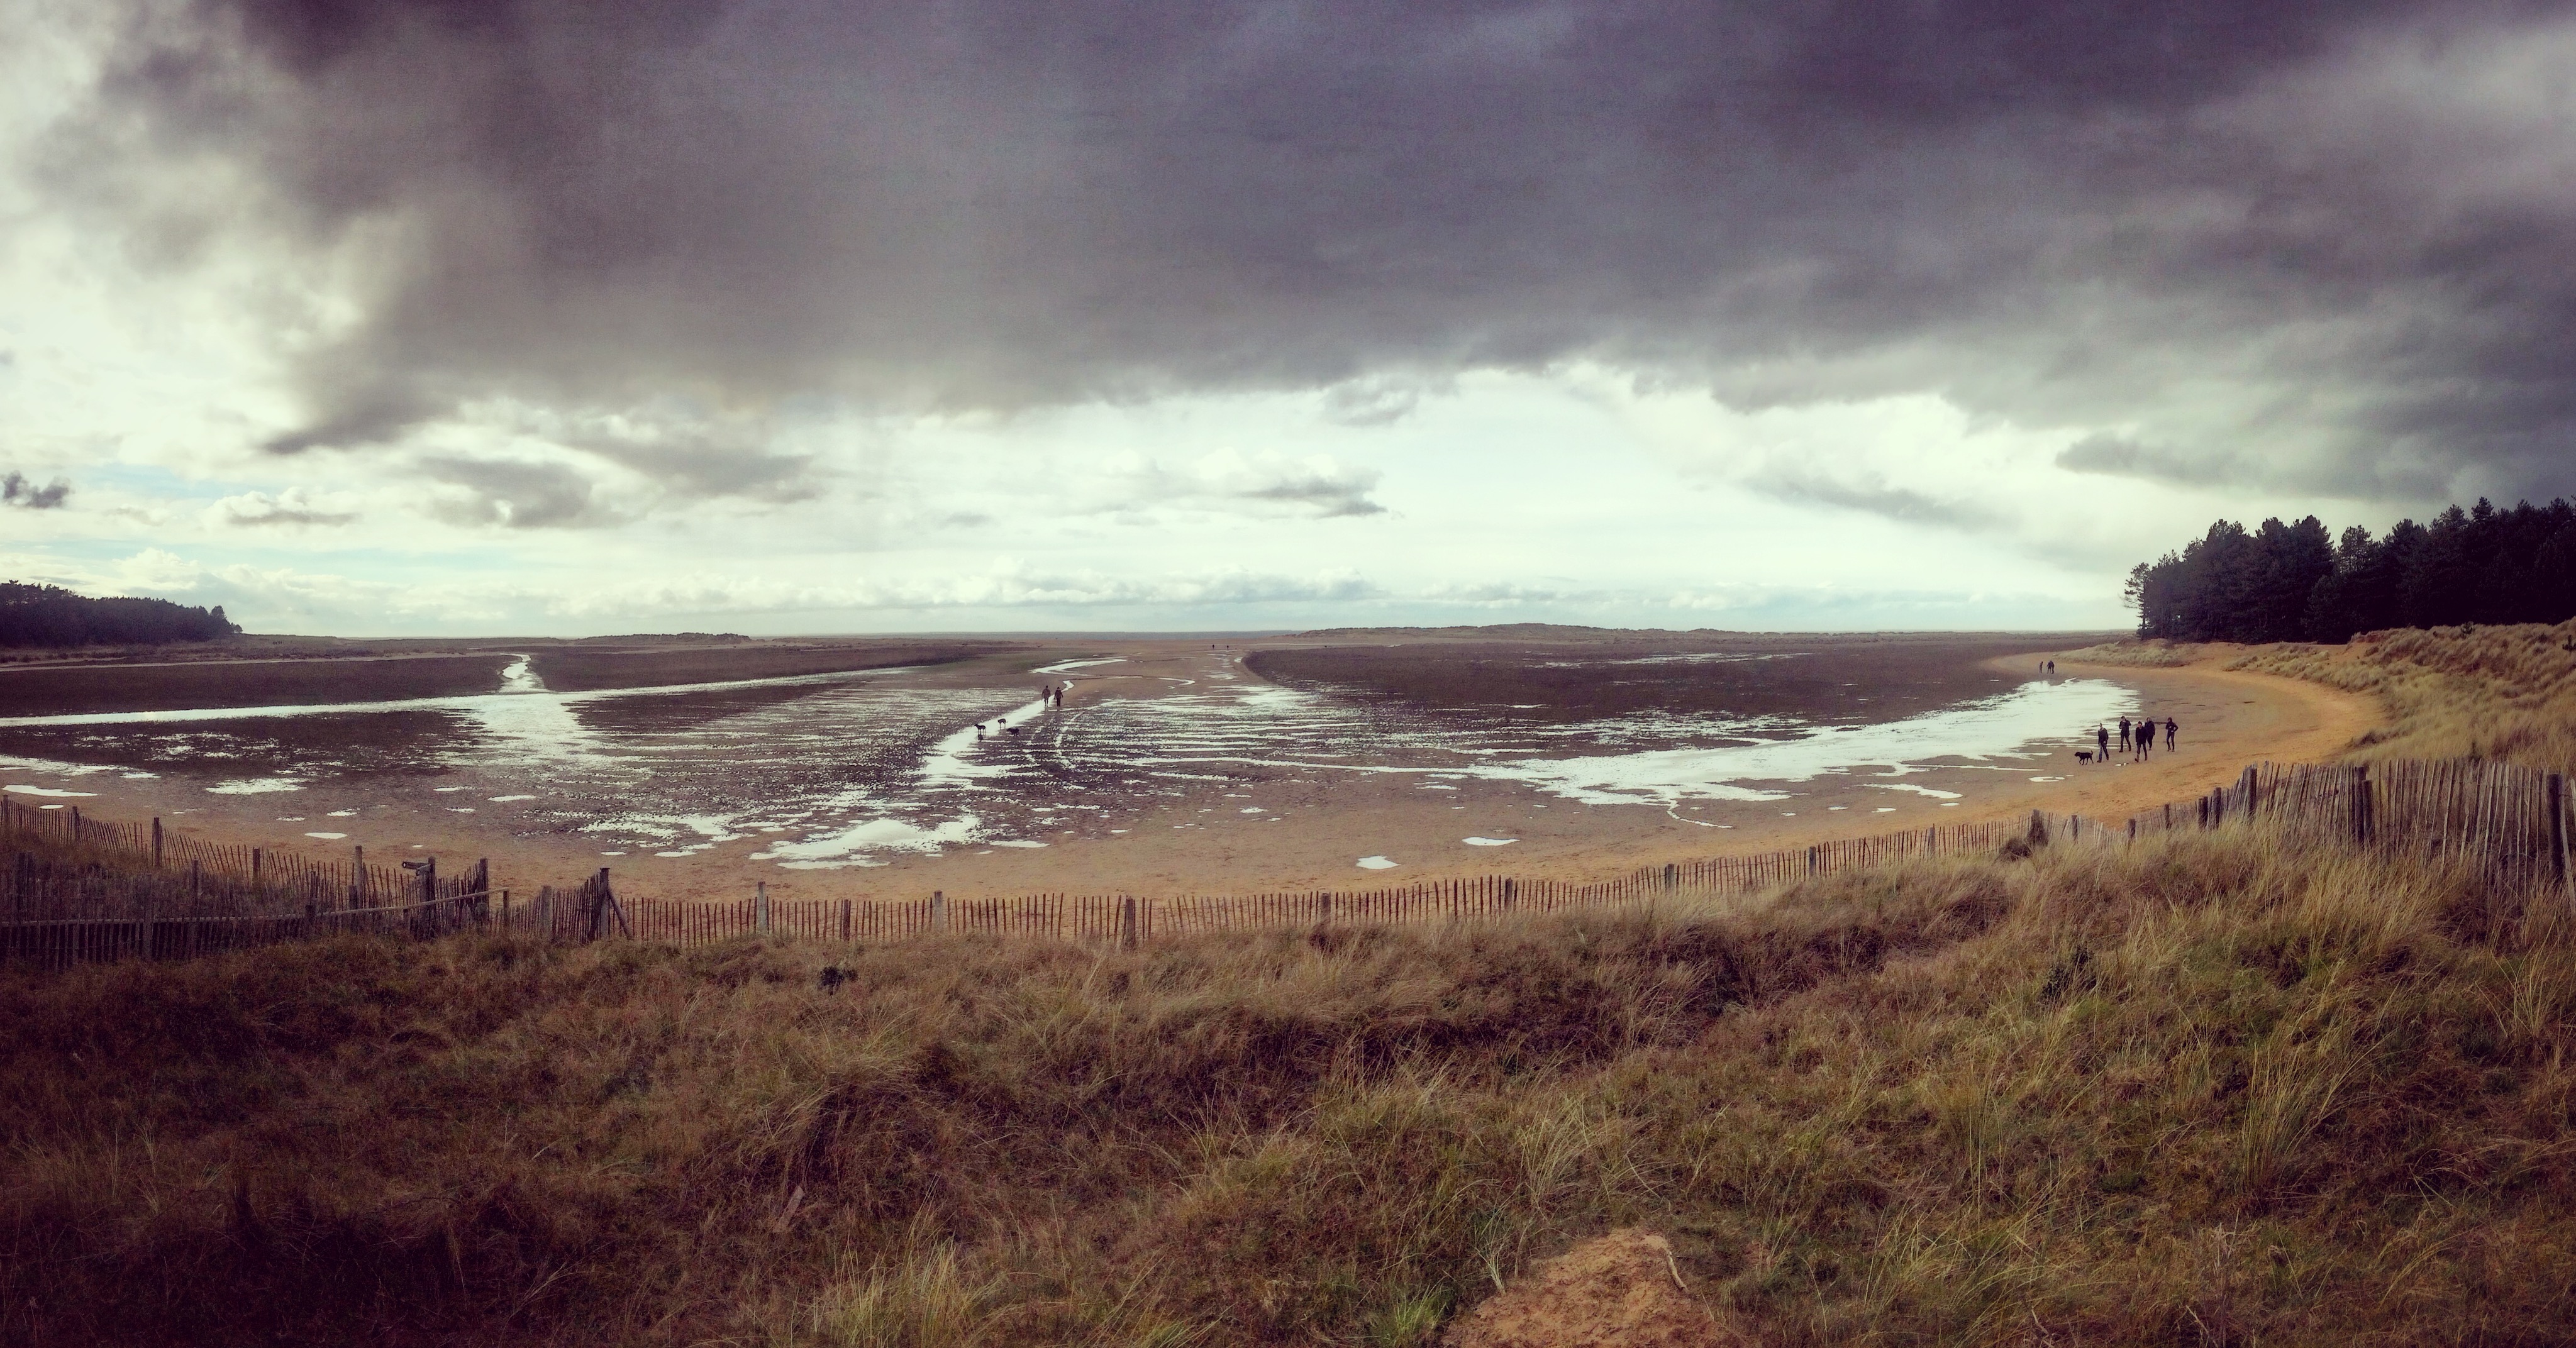
Back in October I developed a twitter bot based on Matt Dray’s londonmapbot. I’ve recently been thinking about other projects that might make good opportunities for learning, and thus blog posts. One idea was for a new addition to the mapbotverse1, which started as just tweeting a random location along the British coastline with maybe some of the same features as the narrowbotR but as I thought about it I wondered whether to make this a slightly more sophisticated bot.
2020-11-21Prompt-moting a custom R prompt
The default prompt in the R console merely indicates it’s awaiting input. A single less than sign to signify R has nothing to do and wants you to give it a task. Back in October there was a mild buzz on #Rstats twitter about customising your R prompt after Romain Francois gave a talk at the R Addicts Paris Meetup. As documented in this RTask blog Romain’s prompt informs him of the active git branch and how much memory R is using. I’ve had a custom prompt for a while so I thought I’d write a short post about my setup.
2020-10-14Virtual Gongoozling

gongoozler [n] a person who enjoys watching boats and activities on canals
I’m sure I’m not the first person, and won’t be the last, to remark that 2020 is a very strange year. October 2020 marks five years since I last went on a canal boat holiday. An anniversary that at the outset of this year I had hoped I might have managed to avoid by taking to the water sometime over the summer. So, inspired by Matt Dray’s recent adventures in location-based Twitter-botting, I wondered whether it might be possible to make a Twitter bot that showcased features of the British canal network. So let me introduce you to narrowbotR … see what I did there, an R based twitter bot that does things narrowboats do.
2020-06-26The interplanetary birthday express

Hello Humans, we cake in peace. We here at the Interplanetary Cake Union have noticed that you are missing out on the opportunity of celebrating your birthday more often by not knowing about your birthdays on other planets, and thus are potentially depriving yourself of more cake eating opportunities. Please use our birthday planets tool to review your age on other planets in the solar system, when your next birthday is and then use our Interplanetary Birthday Express service to order yourself a galactic collection of cake1.
2020-06-23The intersectionality of Black Lives Matter, pride and being a civil servant and a data scientist

On 25th May 2020 George Floyd was killed by police in Minneapolis. His death has sparked protests not just in the USA but around the world. Like many Civil Service organisations, our departmental race champion posted a blog about the Black Lives Matter movement at the start of June. This coincided with a short twitter thread I posted about these latest Black Lives Matters protests rising at the intersection of the start of what is increasingly seen as LGBT+ Pride Month1 in the US (and to some degree here in the UK too).
2020-05-25The Tidyvision Song Contest: Part Deux
My last post explored using the {tidymodels} package with data about the Eurovision Song Contest1. One of the best things to do when exploring a dataset is to visualise it, so let’s also use this dataset to learn about the {gganimate} package that provides ways to create animated charts.
We’ll reuse the eurovision_scores dataset produced from the code in my last post. First let’s take a look at UK performance over time, we also need to filter out data from 1991 where Sweden and France both gained 146 points (but due to the complex rules in place at the time Sweden won, however under the current rules France would have won).
2020-05-23The Tidyvision Song Contest
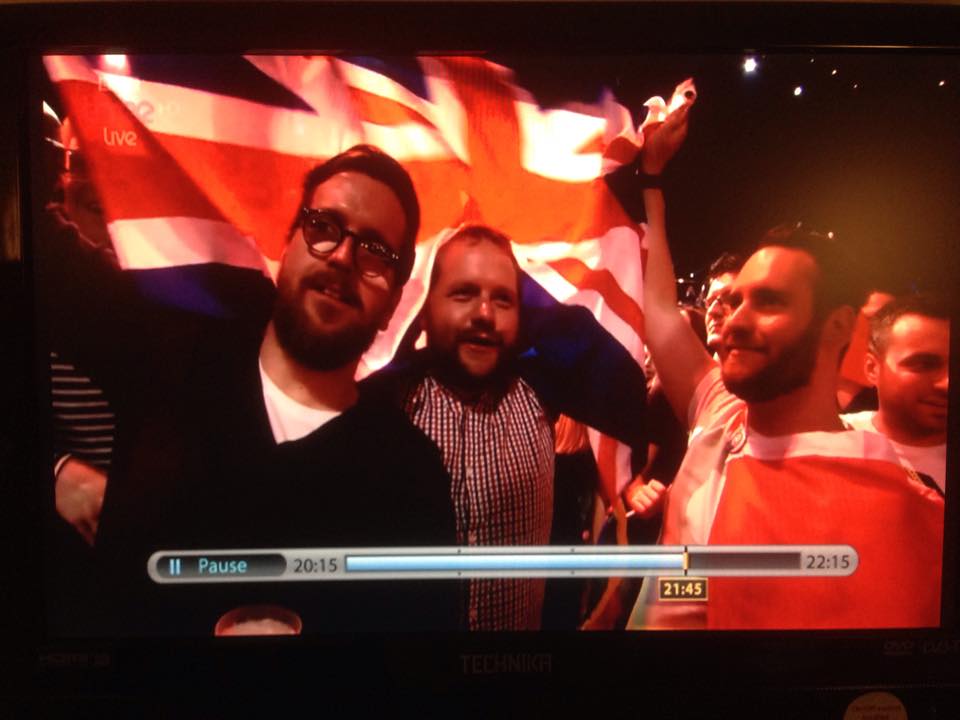
Last Saturday, Saturday 16th May 2020 was scheduled to be the 65th Eurovision Song Contest, but due to the ongoing COVID19 pandemic the contest was cancelled. Eurovision is very special to me, and I’ve been lucky to attend a couple of the finals and semi-finals – and, if you were watching the second semi-final of the 2015 contest you may have even seen me on TV! I’ve recently watched some of Julia Silge’s TidyTuesday webcasts using the {tidymodels} framework, and so instead of watching the EBU’s tribute show and getting rather sad about the contest not happening and Daði Freyr not winning and giving me an even better excuse to go back to Iceland1 I decided to play with {tidymodels} and the Datagraver’s Eurovision points dataset on Kaggle.
2020-04-25When's the case for case_when() ?

Last week I was taking some colleagues through the code for my COVID19 PDF scraping and afterwards one sent me a message asking about a chunk of code that used the dplyr::case_when() function. In particular they wanted to know why case_when() uses the tilde (~)1, which led to a bit more of a generalised conversation about case_when() and how it works.
In your script, when you assign the values to the entity and position columns inside your
case_when()call why do you use~rather than=or<-? It felt too specific and potentially obvious to others to ask during your talk. I understand why it’s used in model building for regression etc… but not really in this context.
2020-04-12Automating the COVID19 PDF scraping
In my last post I wrote about the process for scraping data from Google’s COVID-19 Community Mobility Reports. That post dealt with processing just one report, the one for the UK, but Google have published reports for around 130 countries and one for each of the 50 US states. So we could run the script 180 separate times to extract all the data, but we can easily extend our scripting to automate this process.
2020-04-10Scraping Google's COVID-19 mobility report PDFs
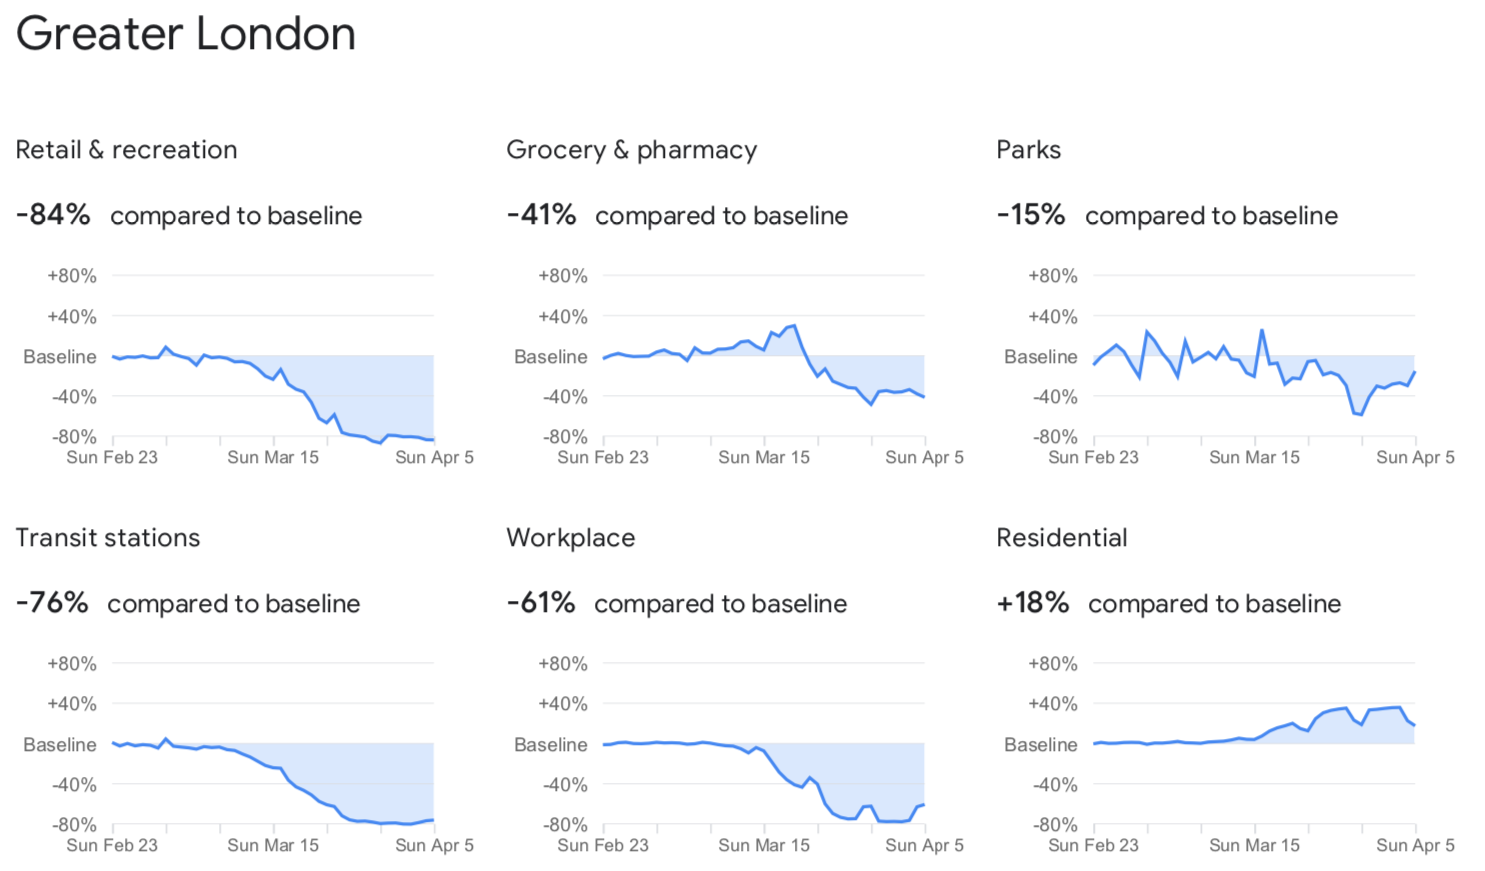
Last week Google published their COVID-19 Community Mobility Reports. These make use of Google’s very extensive location history data, which they mainly use for telling you about traffic levels on roads, popular times for places in Google Maps and whether a bar or restaurant is busier than usual. In these mobility reports they’ve looked at the location history data for a large number of countries, and localities within countries to help public health officials review the effectiveness of social distancing measures.
2020-04-06Hello

Well hello, you! I’m Matt, and this is the first post. I’m not entirely sure how this will turn out, I tried to blog when I was in my early-twenties but that didn’t go very far and is now buried in the digital dust (thankfully). But I’ve been inspired by Matt Dray’s recent post “Dear past self: blog” to start blogging, in particular his idea that his blog is his reference library.