
I’m working on a project where one of the outputs is a deck of Microsoft
PowerPoint slides that act as a reference guide1. Outside of contents,
introductory and annex slides the bulk of the slides follow the same format
with a simple table providing metadata about a suite of around 90 indicators.
Using the gtcars dataset
I’ll demonstrate how I’ve used Quarto and the
{officer} package to automate some
of the workflow.
Background
I’m working in a multi-stakeholder project with clients and stakeholders that aren’t data specialists, the main way they are exchanging information is via PowerPoint slide decks. I’ll admit this makes it easy for people to comment and edit the slides, but it’s not an ideal format for what is at its core a highly structured dataset2.
To maintain my own sanity I’ve been keeping a separate Excel spreadsheet of the reference information so that I can more easily work with it. However, when I’ve then got to send an updated version I need a process to turn the rows of the spreadsheet into separate slides. Once I receive comments, or make my own amendments to the slides I need to regenerate the spreadsheet.
A process that’s ripe for some level of automation.
Using Quarto to generate slides
I’ll use the gtcars dataset
to demonstrate how I’ve used Quarto (and R) to generate a set of slides.
First we set up our qmd file with a YAML header. Quarto has a built-in
format for
PowerPoint
that means it’s pretty easy to produce a slide deck. If you have a template
you can use the reference-doc parameter to declare this, this means that
your output document has the slide designs and layouts matching that template.
We can also define the way data frames are printed.
Let’s also declare an R setup chunk to load the dataset and write some bespoke functions.
---
title: "Reference slides"
format:
  pptx:
    reference-doc: template.potx
    df-print: kable
    tbl-colwidths: [25,75]
---

```{r setup}
#| include: false
#| echo: false
...
```
Let’s declare the reference data set, which in the actual project is
simply a
readxl::read_excel()
call to the relevant sheet. For the example I’m using gtcars from the
{gt} package, so I need to slightly adapt it
to better replicate my example.
metrics_df <- gt::gtcars |>
  dplyr::mutate(
    bdy_style = stringr::str_to_sentence(bdy_style),
    drivetrain = dplyr::if_else(
      drivetrain == "rwd",
      "Rear wheel drive",
      "All wheel drive"
    ),
    transmission = dplyr::case_when(
      trsmn == "1dd" ~ "Single gear direct drive",
      grepl("\\dam$", trsmn) ~
        gsub("am", "-gear automatic and manual transmission", trsmn),
      grepl("\\da$", trsmn) ~
        gsub("a", "-gear automatic transmission", trsmn),
      grepl("\\dm$", trsmn) ~
        gsub("m", "-gear manual transmission", trsmn)
    ),
    notes = character(nrow(gt::gtcars))
  ) |>
  dplyr::mutate(
    id = paste0(
      toupper(substr(mfr, 1, 3)), "-",
      stringr::str_pad(dplyr::row_number(), 2, pad = "0")
    ),
    .by = mfr
  ) |>
  dplyr::select(
    id, mfr, model, year, trim, body_style = bdy_style,
    horsepower = hp, torque = trq, mpg_c, mpg_h, drivetrain, transmission,
    country_of_origin = ctry_origin, suggested_retail_price = msrp, notes
  ) |>
  dplyr::mutate(
    dplyr::across(everything(), as.character)
  )
metrics_df |> dplyr::glimpse()
#> Rows: 47
#> Columns: 15
#> $ id                     <chr> "FOR-01", "FER-01", "FER-02", "FER-03", "FER-04…
#> $ mfr                    <chr> "Ford", "Ferrari", "Ferrari", "Ferrari", "Ferra…
#> $ model                  <chr> "GT", "458 Speciale", "458 Spider", "458 Italia…
#> $ year                   <chr> "2017", "2015", "2015", "2014", "2016", "2015",…
#> $ trim                   <chr> "Base Coupe", "Base Coupe", "Base", "Base Coupe…
#> $ body_style             <chr> "Coupe", "Coupe", "Convertible", "Coupe", "Coup…
#> $ horsepower             <chr> "647", "597", "562", "562", "661", "553", "680"…
#> $ torque                 <chr> "550", "398", "398", "398", "561", "557", "514"…
#> $ mpg_c                  <chr> "11", "13", "13", "13", "15", "16", "12", "11",…
#> $ mpg_h                  <chr> "18", "17", "17", "17", "22", "23", "17", "16",…
#> $ drivetrain             <chr> "Rear wheel drive", "Rear wheel drive", "Rear w…
#> $ transmission           <chr> "7-gear automatic transmission", "7-gear automa…
#> $ country_of_origin      <chr> "United States", "Italy", "Italy", "Italy", "It…
#> $ suggested_retail_price <chr> "447000", "291744", "263553", "233509", "245400…
#> $ notes                  <chr> "", "", "", "", "", "", "", "", "", "", "", "",…
To generate the slides I need to write two functions, one to extract the data for an individual row and one to create a slide header.
metric_tbl <- function(x, id) {

  df <- x |>
    dplyr::filter(id == {{ id }})

  df |>
    dplyr::select(-id, -mfr, -model) |>
    tidyr::pivot_longer(cols = everything()) |>
    dplyr::mutate(
      value = stringr::str_replace_all(value, "\\r\\n"," !!!! "),
      name = dplyr::case_when(
        name == "mpg_c" ~ "MPG (City)",
        name == "mpg_h" ~ "MPG (Highway)",
        TRUE ~ stringr::str_to_sentence(stringr::str_replace_all(name, "_", " "))
      )
    )

}

slide_header <- function(mfr, model) {
  cat("\n##", mfr, cli::symbol$en_dash, model, "\n\n")
}
We can now write a separate R chunk that will generate the slide content. In
this chunk we’ll set the results attribute to asis. This instructs knitr
(the engine behind R code execution) not to try and coerce the output into
a particular format. This is necessary because we want to export markdown
output from our R chunk for Quarto to then process into slides.
```{r}
#| echo: false
#| results: asis
...
```
To generate the slides we simply insert a for loop into this chunk. For each row in the dataset we’ll generate a slide header and then an output table for the relevant metric.
for (i in seq_along(metrics_df$id)) {
  slide_header(metrics_df$mfr[i], metrics_df$model[i])
  print(knitr::kable(metric_tbl(metrics_df, metrics_df$id[i])))
}
Let’s demonstrate what this produces for the first row.
slide_headr(metrics_df$mfr[1], metrics_df$model[1])
knitr::kable(metric_tbl(metrics_df, "FOR-01"))
## Ford – GT

|name                   |value                         |
|:----------------------|:-----------------------------|
|Year                   |2017                          |
|Trim                   |Base Coupe                    |
|Body style             |Coupe                         |
|Horsepower             |647                           |
|Torque                 |550                           |
|MPG (City)             |11                            |
|MPG (Highway)          |18                            |
|Drivetrain             |Rear wheel drive              |
|Transmission           |7-gear automatic transmission |
|Country of origin      |United States                 |
|Suggested retail price |447000                        |
|Notes                  |                              |
Thus the for loop generates a markdown formatted header for each slide using the car’s manufacturer and model, and then a markdown/pandoc format table of the car’s details.
Full qmd code
---
title: "Reference slides"
format:
  pptx:
    reference-doc: template.potx
    df-print: kable
    tbl-colwidths: [25,75]
---

```{r setup}
#| include: false
#| echo: false

metrics_df <- gt::gtcars |>
  dplyr::mutate(
    bdy_style = stringr::str_to_sentence(bdy_style),
    drivetrain = dplyr::if_else(
      drivetrain == "rwd",
      "Rear wheel drive",
      "All wheel drive"
    ),
    transmission = dplyr::case_when(
      trsmn == "1dd" ~ "Single gear direct drive",
      grepl("\\dam$", trsmn) ~
        gsub("am", "-gear automatic and manual transmission", trsmn),
      grepl("\\da$", trsmn) ~
        gsub("a", "-gear automatic transmission", trsmn),
      grepl("\\dm$", trsmn) ~
        gsub("m", "-gear manual transmission", trsmn)
    ),
    notes = character(nrow(gt::gtcars))
  ) |>
  dplyr::mutate(
    id = paste0(
      toupper(substr(mfr, 1, 3)), "-",
      stringr::str_pad(dplyr::row_number(), 2, pad = "0")
    ),
    .by = mfr
  ) |>
  dplyr::select(
    id, mfr, model, year, trim, body_style = bdy_style,
    horsepower = hp, torque = trq, mpg_c, mpg_h, drivetrain, transmission,
    country_of_origin = ctry_origin, suggested_retail_price = msrp, notes
  ) |>
  dplyr::mutate(
    dplyr::across(everything(), as.character)
  )

metric_tbl <- function(x, id) {

  df <- x |>
    dplyr::filter(id == {{ id }})

  df |>
    dplyr::select(-id, -mfr, -model) |>
    tidyr::pivot_longer(cols = everything()) |>
    dplyr::mutate(
      value = stringr::str_replace_all(value, "\\r\\n"," !!!! "),
      name = dplyr::case_when(
        name == "mpg_c" ~ "MPG (City)",
        name == "mpg_h" ~ "MPG (Highway)",
        TRUE ~ stringr::str_to_sentence(stringr::str_replace_all(name, "_", " "))
      )
    )

}

slide_header <- function(mfr, model) {
  cat("\n##", mfr, cli::symbol$en_dash, model, "\n\n")
}

```

```{r}
#| echo: false
#| results: asis
for (i in seq_along(metrics_df$id)) {
  slide_header(metrics_df$mfr[i], metrics_df$model[i])
  print(knitr::kable(metric_tbl(metrics_df, metrics_df$id[i])))
}
```
Quarto then renders the markdown into PowerPoint slides.
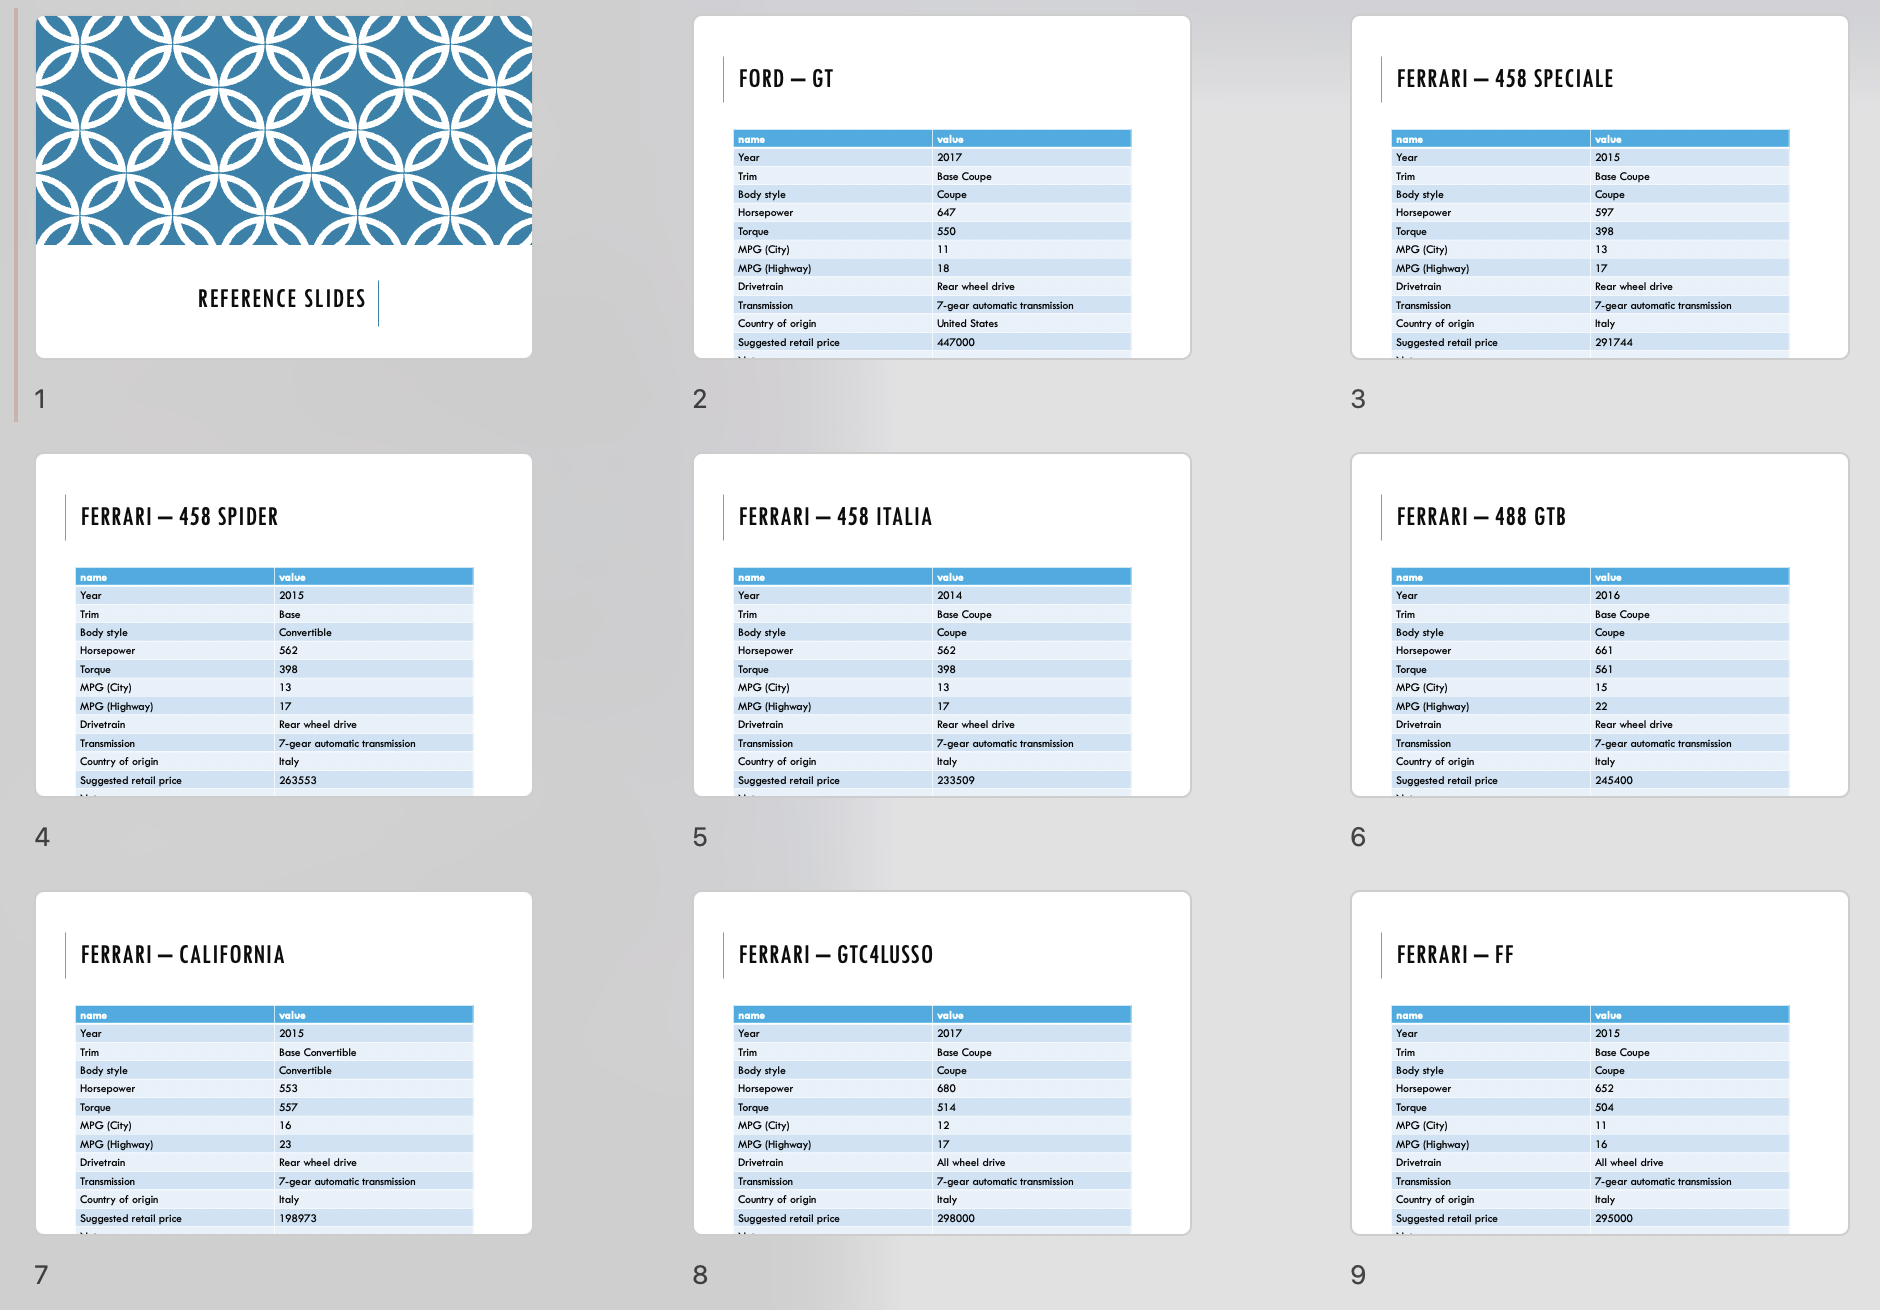
Screenshot of the first nine slides in the output presentation
Unfortunately, in my actual project there are a couple of further manual stages
that need to be applied before the slides are finished. The table needs to be
adjusted both in terms of column widths and font size to make the information
fit on the page and not overflow. I also have to manually insert newlines back
into some cells — these were replaced in my actual metric_tbl()
function because otherwise they would cause problems in processing for Quarto
when it is processing the markdown.
Using {officer} to read in data from PowerPoint
After the slides have been distributed one or more stakeholders may make
amendments to the slides. The {officer}
package enables you to access the content of PowerPoint documents. This means
I can convert the PowerPoint document back into a dataset/spreadsheet. First
we read in the pptx file and then extract a summary of the content.
gt_pptx <- officer::read_pptx("gtcars_test.pptx")
gt_content <- officer::pptx_summary(gt_pptx) |>
  tibble::as_tibble() |>
  dplyr::filter(text != "")

gt_content
#> # A tibble: 1,223 × 8
#>    text             id    content_type slide_id row_id cell_id col_span row_span
#>    <chr>            <chr> <chr>           <int>  <int>   <int>    <int>    <int>
#>  1 Reference slides 2     paragraph           1     NA      NA       NA       NA
#>  2 Ford – GT        2     paragraph           2     NA      NA       NA       NA
#>  3 name             6     table cell          2      1       1        1        1
#>  4 Year             6     table cell          2      2       1        1        1
#>  5 Trim             6     table cell          2      3       1        1        1
#>  6 Body style       6     table cell          2      4       1        1        1
#>  7 Horsepower       6     table cell          2      5       1        1        1
#>  8 Torque           6     table cell          2      6       1        1        1
#>  9 MPG (City)       6     table cell          2      7       1        1        1
#> 10 MPG (Highway)    6     table cell          2      8       1        1        1
#> # ℹ 1,213 more rows
#> # ℹ Use `print(n = ...)` to see more rows
This gives us a tibble with a row per text element in the PowerPoint document
along with ID/location references and content_type. The id column here is
not a unique ID but rather something relating to the ID of the object within the
slide - because the example slides are identical in construction the slide title
is always has an id of 2, and the table cells all have an id of 6
(presumably the id value of the constituent table).
The first step to wrangling this content back into a dataset is to use the
location information (row_id and cell_id) to identify whether the text
is a column name in our original dataset or a value. The manufacturer and
model info is contained in the slide title, so we first need to give those
notional row_id and cell_id values.
metrics_df <- gt_content |>
  dplyr::filter(slide_id > 1, id == 2 | id == 6) |>
    dplyr::mutate(
      cell_id = dplyr::if_else(col_span == 2, 2, cell_id),
      cell_id = tidyr::replace_na(cell_id, 2),
      row_id = tidyr::replace_na(row_id, 0),
      type = dplyr::if_else(cell_id == 1, "name", "value")
    )

metrics_df

#> # A tibble: 1,222 × 9
#>    text          id    content_type slide_id row_id cell_id col_span row_span type
#>    <chr>         <chr> <chr>           <int>  <int>   <dbl>    <int>    <int> <chr>
#>  1 Ford – GT     2     paragraph           2      0       2       NA       NA value
#>  2 name          6     table cell          2      1       1        1        1 name
#>  3 Year          6     table cell          2      2       1        1        1 name
#>  4 Trim          6     table cell          2      3       1        1        1 name
#>  5 Body style    6     table cell          2      4       1        1        1 name
#>  6 Horsepower    6     table cell          2      5       1        1        1 name
#>  7 Torque        6     table cell          2      6       1        1        1 name
#>  8 MPG (City)    6     table cell          2      7       1        1        1 name
#>  9 MPG (Highway) 6     table cell          2      8       1        1        1 name
#> 10 Drivetrain    6     table cell          2      9       1        1        1 name
#> # ℹ 1,212 more rows
#> ℹ Use `print(n = ...)` to see more rows
We can now pivot this tibble in order to get a dataset of name-value pairs.
metrics_df <- metrics_df |>
  tidyr::pivot_wider(
    names_from = type,
    values_from = text,
    id_cols = c(slide_id, row_id)
  )

metrics_df
#> # A tibble: 658 × 4
#>    slide_id row_id value            name
#>       <int>  <int> <chr>            <chr>
#>  1        2      0 Ford – GT        NA
#>  2        2      1 value            name
#>  3        2      2 2017             Year
#>  4        2      3 Base Coupe       Trim
#>  5        2      4 Coupe            Body style
#>  6        2      5 647              Horsepower
#>  7        2      6 550              Torque
#>  8        2      7 11               MPG (City)
#>  9        2      8 18               MPG (Highway)
#> 10        2      9 Rear wheel drive Drivetrain
#> # ℹ 648 more rows
#> # ℹ Use `print(n = ...)` to see more rows
The name column can then be processed to provide strings that are suitable
for the column names of a tibble (e.g. replacing spaces with underscores,
converting to lower case and removing parentheses).
metrics_df <- metrics_df |>
  dplyr::mutate(
    name = dplyr::case_when(
      is.na(name) ~ "mfr_model",
      TRUE ~ tolower(stringr::str_replace_all(name, "[^A-z]", "_"))
    ),
    name = gsub("__", "_", name),
    name = gsub("_$", "", name)
  )

metrics_df
#> # A tibble: 658 × 4
#>    slide_id row_id value            name
#>       <int>  <int> <chr>            <chr>
#>  1        2      0 Ford – GT        mfr_model
#>  2        2      1 value            name
#>  3        2      2 2017             year
#>  4        2      3 Base Coupe       trim
#>  5        2      4 Coupe            body_style
#>  6        2      5 647              horsepower
#>  7        2      6 550              torque
#>  8        2      7 11               mpg_city
#>  9        2      8 18               mpg_highway
#> 10        2      9 Rear wheel drive drivetrain
#> # ℹ 648 more rows
#> # ℹ Use `print(n = ...)` to see more rows
This tibble can then be pivoted again to get back to a “wide” format dataset where each column is a separate variable.
metrics_df <- metrics_df |>
  tidyr::pivot_wider(
    names_from = name,
    values_from = value,
    id_cols = slide_id
  )

metrics_df |> dplyr::glimpse()
#> Rows: 47
#> Columns: 15
#> $ slide_id               <int> 2, 3, 4, 5, 6, 7, 8, 9, 10, 11, 12, 13, 14, 15,…
#> $ mfr_model              <chr> "Ford – GT", "Ferrari – 458 Speciale", "Ferrari…
#> $ name                   <chr> "value", "value", "value", "value", "value", "v…
#> $ year                   <chr> "2017", "2015", "2015", "2014", "2016", "2015",…
#> $ trim                   <chr> "Base Coupe", "Base Coupe", "Base", "Base Coupe…
#> $ body_style             <chr> "Coupe", "Coupe", "Convertible", "Coupe", "Coup…
#> $ horsepower             <chr> "647", "597", "562", "562", "661", "553", "680"…
#> $ torque                 <chr> "550", "398", "398", "398", "561", "557", "514"…
#> $ mpg_city               <chr> "11", "13", "13", "13", "15", "16", "12", "11",…
#> $ mpg_highway            <chr> "18", "17", "17", "17", "22", "23", "17", "16",…
#> $ drivetrain             <chr> "Rear wheel drive", "Rear wheel drive", "Rear w…
#> $ transmission           <chr> "7-gear automatic transmission", "7-gear automa…
#> $ country_of_origin      <chr> "United States", "Italy", "Italy", "Italy", "It…
#> $ suggested_retail_price <chr> "447000", "291744", "263553", "233509", "245400…
#> $ notes                  <chr> NA, NA, NA, NA, NA, NA, NA, NA, NA, NA, NA, NA,…
Finally, we can split out the manufacturer and model into separate columns,
regenerate the individual id for each car, and drop the slide_id
metrics_df <- metrics_df |>
  tidyr::separate(mfr_model, into = c("mfr", "model"), sep = " – ") |>
  dplyr::mutate(
    id = paste0(
      toupper(substr(mfr, 1, 3)), "-",
      stringr::str_pad(dplyr::row_number(), 2, pad = "0")
    ),
    .by = mfr, .before = mfr
  ) |>
  dplyr::select(-slide_id)

metrics_df |> dplyr::glimpse()
#> Rows: 47
#> Columns: 16
#> $ id                     <chr> "FOR-01", "FER-01", "FER-02", "FER-03", "FER-04…
#> $ mfr                    <chr> "Ford", "Ferrari", "Ferrari", "Ferrari", "Ferra…
#> $ model                  <chr> "GT", "458 Speciale", "458 Spider", "458 Italia…
#> $ name                   <chr> "value", "value", "value", "value", "value", "v…
#> $ year                   <chr> "2017", "2015", "2015", "2014", "2016", "2015",…
#> $ trim                   <chr> "Base Coupe", "Base Coupe", "Base", "Base Coupe…
#> $ body_style             <chr> "Coupe", "Coupe", "Convertible", "Coupe", "Coup…
#> $ horsepower             <chr> "647", "597", "562", "562", "661", "553", "680"…
#> $ torque                 <chr> "550", "398", "398", "398", "561", "557", "514"…
#> $ mpg_city               <chr> "11", "13", "13", "13", "15", "16", "12", "11",…
#> $ mpg_highway            <chr> "18", "17", "17", "17", "22", "23", "17", "16",…
#> $ drivetrain             <chr> "Rear wheel drive", "Rear wheel drive", "Rear w…
#> $ transmission           <chr> "7-gear automatic transmission", "7-gear automa…
#> $ country_of_origin      <chr> "United States", "Italy", "Italy", "Italy", "It…
#> $ suggested_retail_price <chr> "447000", "291744", "263553", "233509", "245400…
#> $ notes                  <chr> NA, NA, NA, NA, NA, NA, NA, NA, NA, NA, NA, NA,…
This can now be saved out in your preferred format for reference/editing.
In my actual project there’s a bit more going on, mainly to handle character encoding issues — as Microsoft defaults to something other than UTF-8 causing endless problems for everyone.
Hurrah! We’ve now got a semi-automated process for converting reference information stored in a spreadsheet to PowerPoint slides and back again.