
I created govukhugo in my last
couple of years working for the Cabinet Office’s Analysis & Insight Team. But
in July last year I left that role, and government. But I’m aware, via
sources1, there have been some requests within government for updates,
including support for Quarto. So I’ve thought a bit about where next for the
project2. This post has turned out to be a bit of a stream of
consciousness/potted history of the development of govukhugo, so there’s
also a TLDR summary if you want to skip to the end.
A short overview of govukhugo
The purpose of govukhugo is to help analysts in government to build
“data-heavy” web content that aligns with the
GOV.UK design system3. Conceptually,
it can be considered a successor to the, now archived,
{govdown} R package which was
developed to produce output from RMarkdown
the matched the standard format GOV.UK pages, however in contrast to
{govdown} the application of the GOV.UK design system was heavily influenced
by the UK government’s coronavirus dashboard.
My main inspiration for govukhugo were the limitations I had encountered in
using the {govdown} package. Having been built as an extension to
{bookdown}, {govdown} did not support sub-folders
and therefore it was difficult to organise sites where a hierarchical
navigation structure or file organisation, would be useful. This dependency on
{bookdown} also creates a reliance on the pandoc
engine (and thus Lua) in order to maintain and extend
the package, a non-trivial requirement given how regularly the GOV.UK design
system is updated. Hugo’s base format is to convert standard markdown format
files, however it can also convert HTML files which means in theory it can
also work with Python or other means of generating HTML content. A further
benefit of using Hugo is its support for
“shortcodes” which provide
significant flexibility for supporting the
styles and
components of the GOV.UK
design system4.
While I had used {govdown} to produce a number of interactive outputs, I
quickly became frustrated with the portrait orientation of the standard GOV.UK
layout which it replicates. The GOV.UK design system implements a maximum
width of 960 pixels, which supports a common principle in
typography
that prose should have a maximum line length of 45-90 characters. However, I
would contend that data heavy applications are different and are often better
suited to a landscape orientation, and thus where there is more screen real
estate available it should be used.
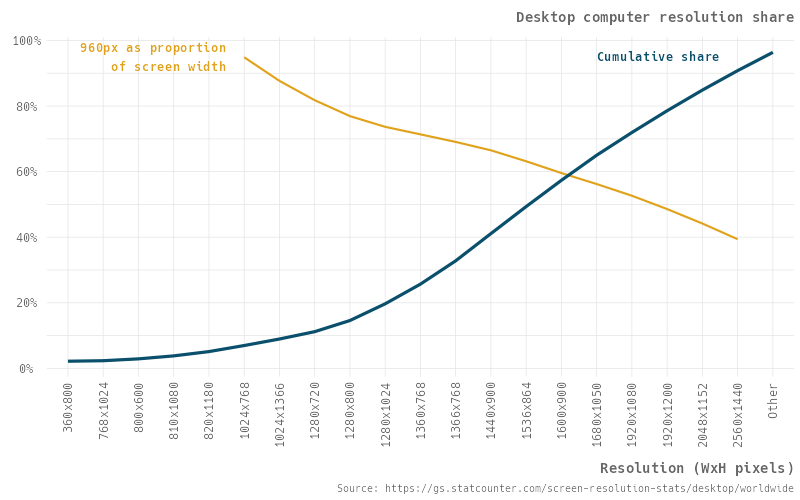
Distribution of desktop resolutions
Plot code
library(ggplot2)

# "https://gs.statcounter.com/screen-resolution-stats/desktop/chart.php?
# device=Desktop&device_hidden=desktop&statType_hidden=resolution&
# region_hidden=ww&granularity=monthly&statType=Screen%20Resolution&
# region=Worldwide&fromInt=202203&toInt=202303&fromMonthYear=2022-03&
# toMonthYear=2023-03&csv=1"

resolution_data <- readr::read_csv("~/Downloads/resolution-ww-monthly-202203-202303-bar.csv") |>
  purrr::set_names(c("resolution", "share")) |>
  dplyr::mutate(
    share = share/100,
    width = dplyr::case_when(
      resolution == "Other" ~ 9999,
      TRUE ~ as.numeric(gsub("x.*", "", resolution))
    ),
    height = dplyr::case_when(
      resolution == "Other" ~ 9999,
      TRUE ~ as.numeric(gsub("^\\d+x", "", resolution))
    ),
  ) |>
  dplyr::arrange(width, height) |>
  dplyr::mutate(
    cml_share = cumsum(share),
    resolution = forcats::as_factor(resolution),
    govuk_width = dplyr::if_else(width < 960 | width == 9999, NA_real_, 960/width)
  )

ggplot(resolution_data, aes(x = resolution, y = cml_share, group = 1)) +
  geom_smooth(aes(y = govuk_width), colour = "#E0A21B", se = FALSE) +
  geom_smooth(colour = "#0A4F6B", size = 1.5, se = FALSE) +
  scale_y_continuous(labels = scales::percent, breaks = seq(0, 1, 0.2)) +
  labs(
    title = "Desktop computer resolution share",
    y = NULL,
    x = "Resolution (WxH pixels)",
    caption = "Source: https://gs.statcounter.com/screen-resolution-stats/desktop/worldwide"
  ) +
  annotate(
    geom = "text",
    x = 5.5, y = 0.95,
    label = "960px as proportion\nof screen width",
    hjust = 1,
    family = "Hack", colour = "#E0A21B", size = 4.5, fontface = "bold"
  ) +
  annotate(
    geom = "text",
    x = 19.5, y = 0.95,
    label = "Cumulative share",
    hjust = 1,
    family = "Hack", colour = "#0A4F6B", size = 4.5, fontface = "bold"
  ) +
  mattR::theme_lpsdgeog() +
  theme(
    plot.title = element_text(size = 14),
    plot.caption = element_text(size = 10),
    axis.title.x = element_text(size = 14),
    axis.title.y = element_text(size = 14),
    axis.text = element_text(size = 12),
    axis.text.x = element_text(angle = 90, hjust = 1)
  )
When we consider common desktop resolutions the limitation of 960 pixels has the potential to leave a large amount of empty space. Only 10% of desktop users have a screen resolution with a width of 1024 pixels or less while over 25% of desktop users have a screen resolution of 1920 pixels or more. That isn’t to ignore the importance to build web pages using responsive web design principles or ignoring mobile device users, but again I would contend that data intensive users are more likely to be using laptop/desktop computers, or possibly tablets, than a mobile phone.
My experience of the {blogdown} package
introduced me to the Hugo static site builder which I found to be a very
versatile technology that has a relatively easy learning curve. This led me
to consider building a successor to {govdown} that combined {blogdown} with
a custom Hugo theme based on the GOV.UK design system.
While my experiments with porting the GOV.UK frontend to Hugo were successful,
the desired integration with {blogdown} was less fruitful, due to the
conventions/assumptions of {blogdown} and RMarkdown as well as common
{htmlwidgets} extensions used in interactive
RMarkdown documents not integrating with the Design System nicely5.
Therefore in addition to a Hugo theme, a companion R package was developed to
support the use of govukhugo that allowed analysts to create content using
RMarkdown in a similar way to they were already used to. The R package handles
conversion of RMarkdown documents to HTML that can be processed by Hugo, as well
as helper functions to support the inclusion of static
{ggplot2} charts as SVG graphics6, as
well as interactive components from the
{DT},
{plotly},
{leaflet} and
{crosstalk} packages.
Meanwhile, Public Health England (now the UK Health Security Agency) had been
developing the UK Government’s
coronavirus dashboard.
The dashboard became a crucial tool for people across the UK – officials
throughout the UK public sector, businesses, civil society organisations, and
the general public – to understand and analyse the extent and impact of
the Covid-19 pandemic in the UK as it evolved. The coronavirus dashboard
adapted the GOV.UK design system for use in a data visualisation application
in ways that overcame the limitations I had been experiencing, through
{govdown}, with the standard portrait orientation implied by the design system.
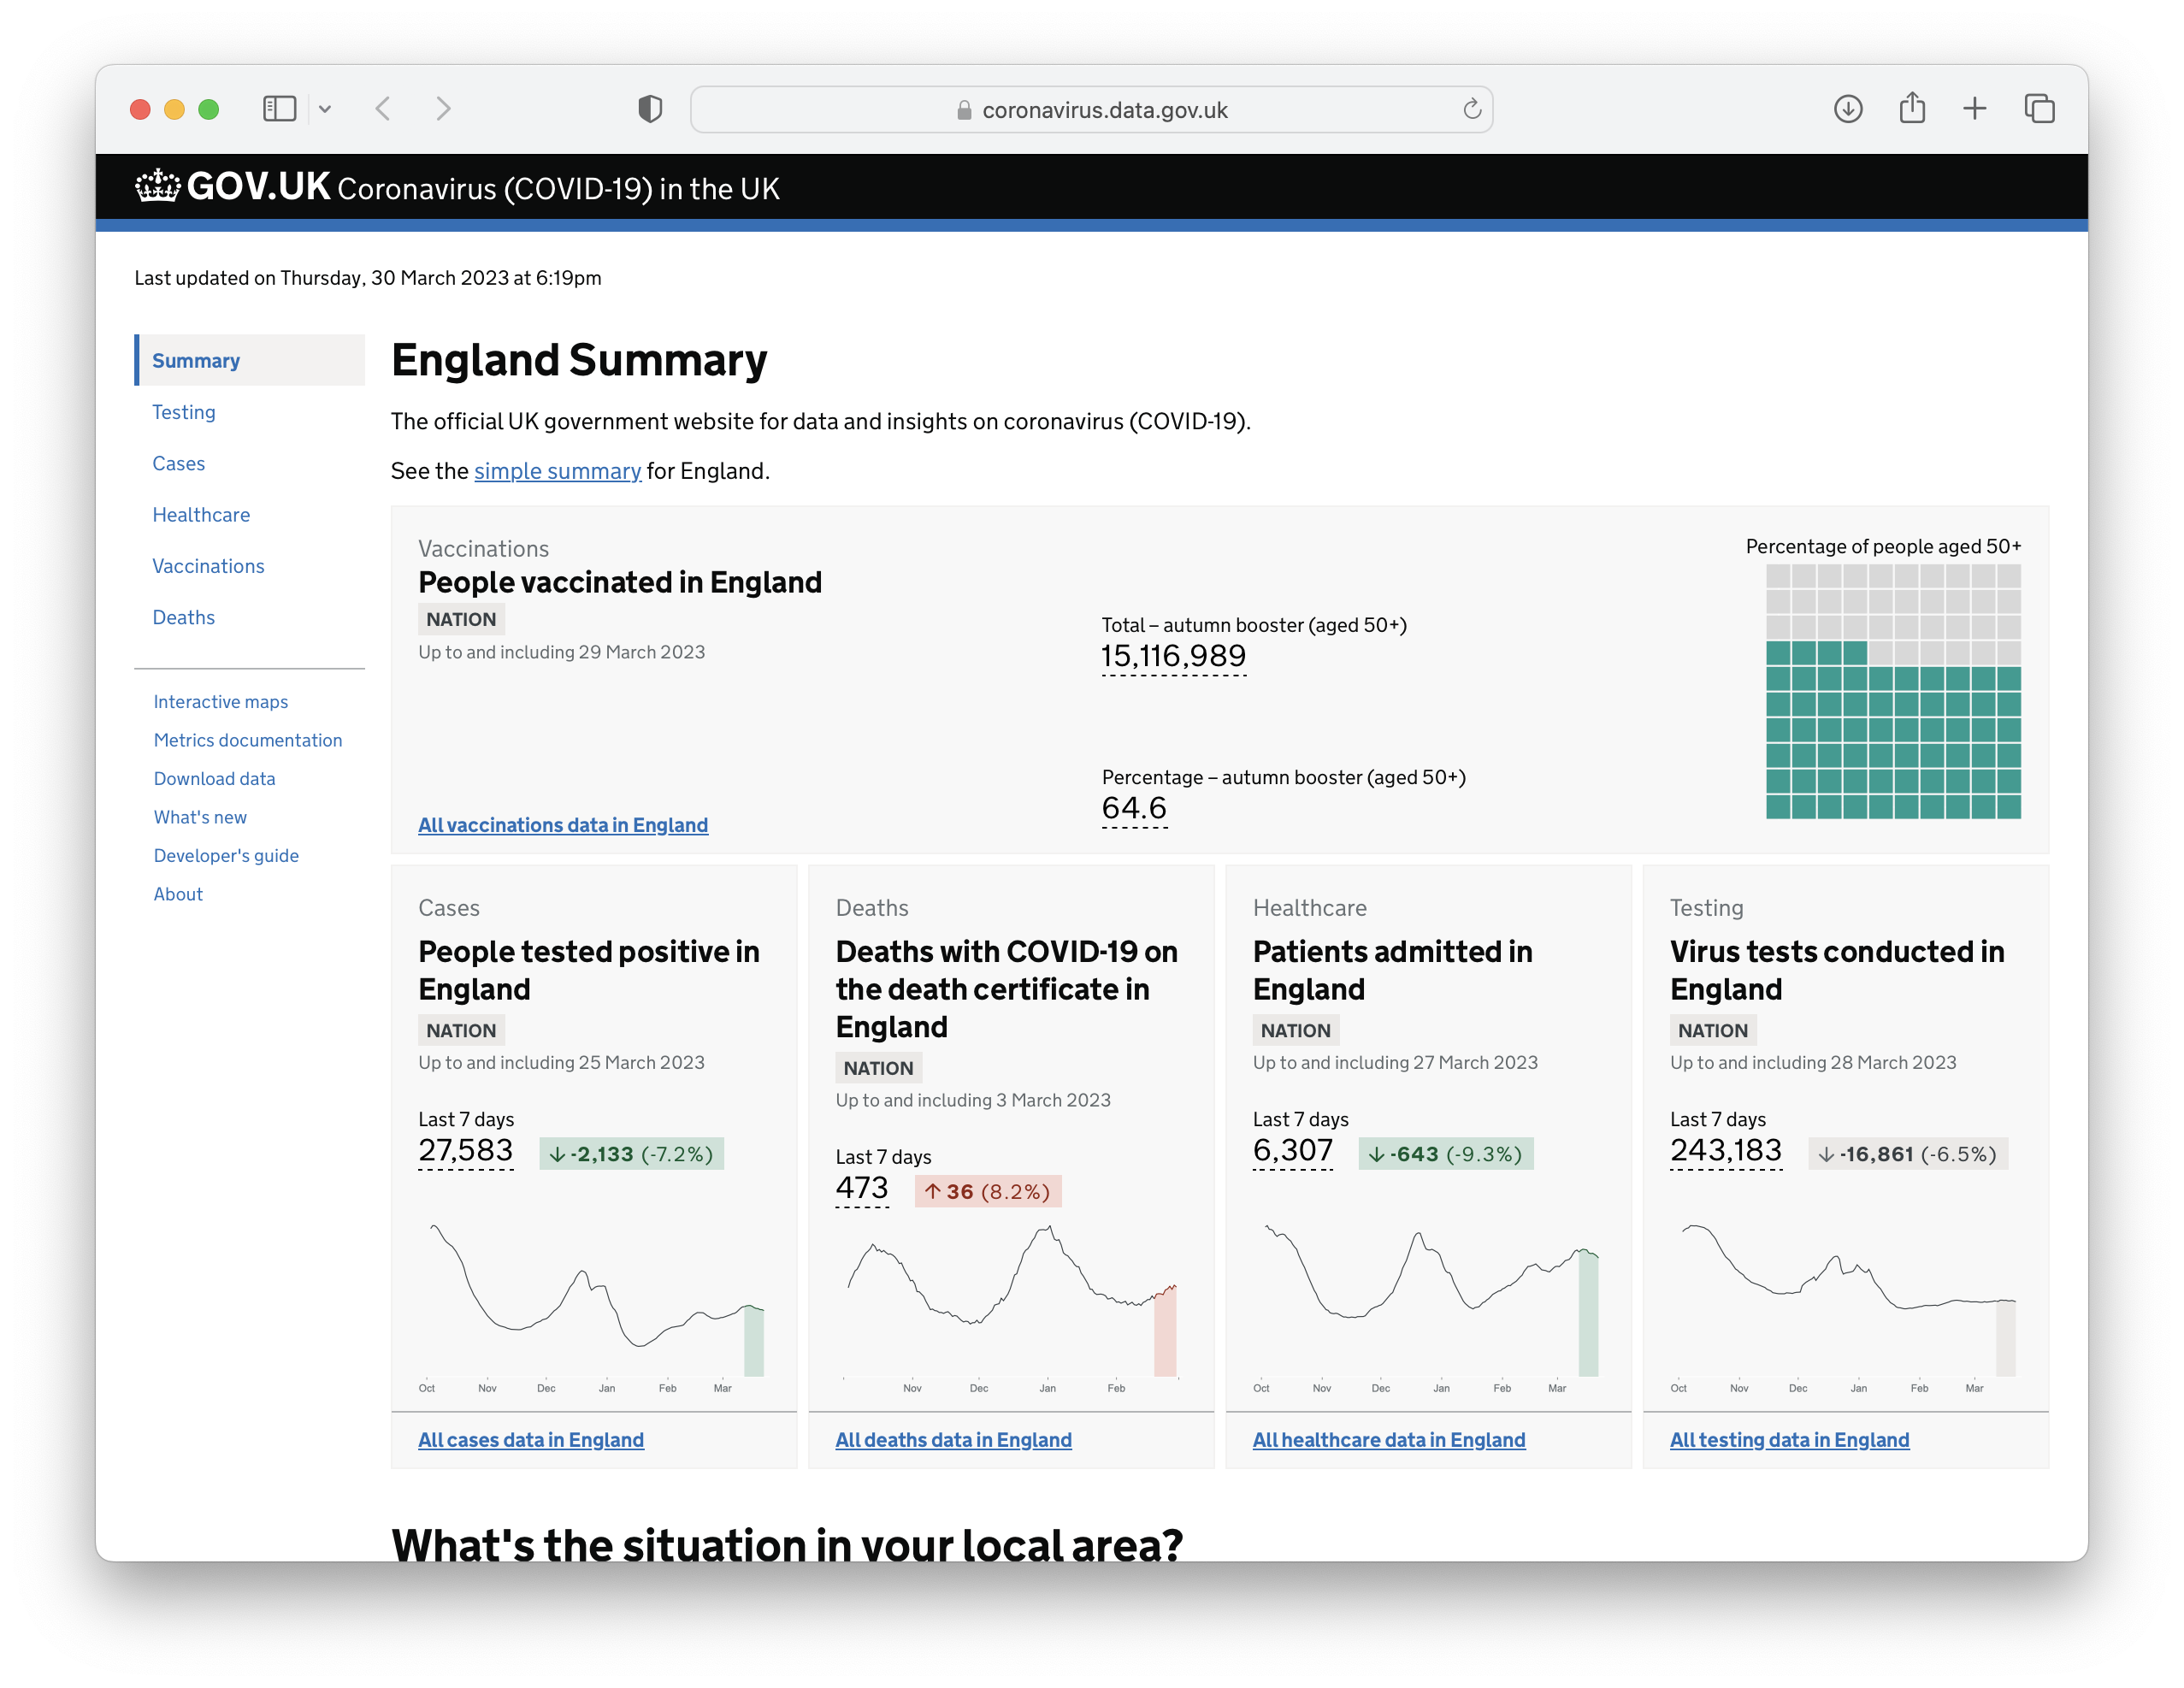
Screenshot of the GOV.UK Coronavirus dashboard
The coronavirus dashboard thereby served as a conceptual model for layout and
decision choices in building govukhugo.
The lonely govukhugo developer
My initial thoughts about what would go on to become govukhugo started at
some point in late 2020 when I was considering an update to my work creating
interactive maps of the UK Civil
Service workforce by location, which had been created with {govdown}. Back in
April 2020 I had set up this blog so
I’d become familiar with the fundamentals of Hugo as I explored and extended
the blog’s theme7. Around this time, or perhaps a bit earlier in 2020,
I’d discussed some of the limitations of {govdown} with the package developer,
Duncan Garmonsway at the
Government Digital Service,
about the issues I’d had and my thoughts about the package’s future. In
particular I proposed the switching {govdown} from being based on
{bookdown} to {blogdown}, but this would be a fairly extensive exercise.
So, I concluded that it would be best to start from scratch rather than
attempting to re-engineer an existing package.
Within my division there were several potential uses cases for a package that could help improve the presentation and publication of statistics and analysis, such as: the already mentioned Civil Service mapping work, presentation of other outputs from the Civil Service Statistics, the results from the Civil Service People Survey. However, it was difficult to convince senior managers of the benefit of this activity8.
Organisational changes led to my role changing and having more of an internal
focus, helping others in my division adopt code-first approaches to analysis
and make better use of new technologies and techniques for analysis. I used
this as an opportunity to devote time to developing a {govdown} successor,
and so in early 2021 govukhugo came to life. However, other necessary changes
– specifically, a member of staff being released from another team
within the division to come and work for me and other teams being able to
make time to actively re-engineer their process and focus on innovative
improvements – never materialised constraining what I was able to
achieve in this new role9.
I won’t document here the development process or design choices, but I am indebted to the work of the team at Public Health England/UK Health Security Agency for their work on the coronavirus dashboard and the general design principles it set in place for data-heavy GOV.UK styled websites.
By the time I left the Civil Service at the end of July 2022, I wouldn’t
consider govukhugo finished but it is in a minimally usable state, the
theme is stable and there is support for some interactive R widgets ({DT},
{plotly}, {leaflet} and {crosstalk}).
I also created some prototypes of govukhugo in action10:
- a response rate tracker for the 2021 Civil Service People Survey so survey managers and senior leaders in different organisations could compare their performance with others (something only possible at the time inside the Qualtrics platform used to deliver the survey by uploading a static image);
- a “People Survey data explorer” showing how results from the People Survey could be published in addition to the verbose spreadsheets currently published; and,
- an example of how to publish data from the Civil Service Statistics.
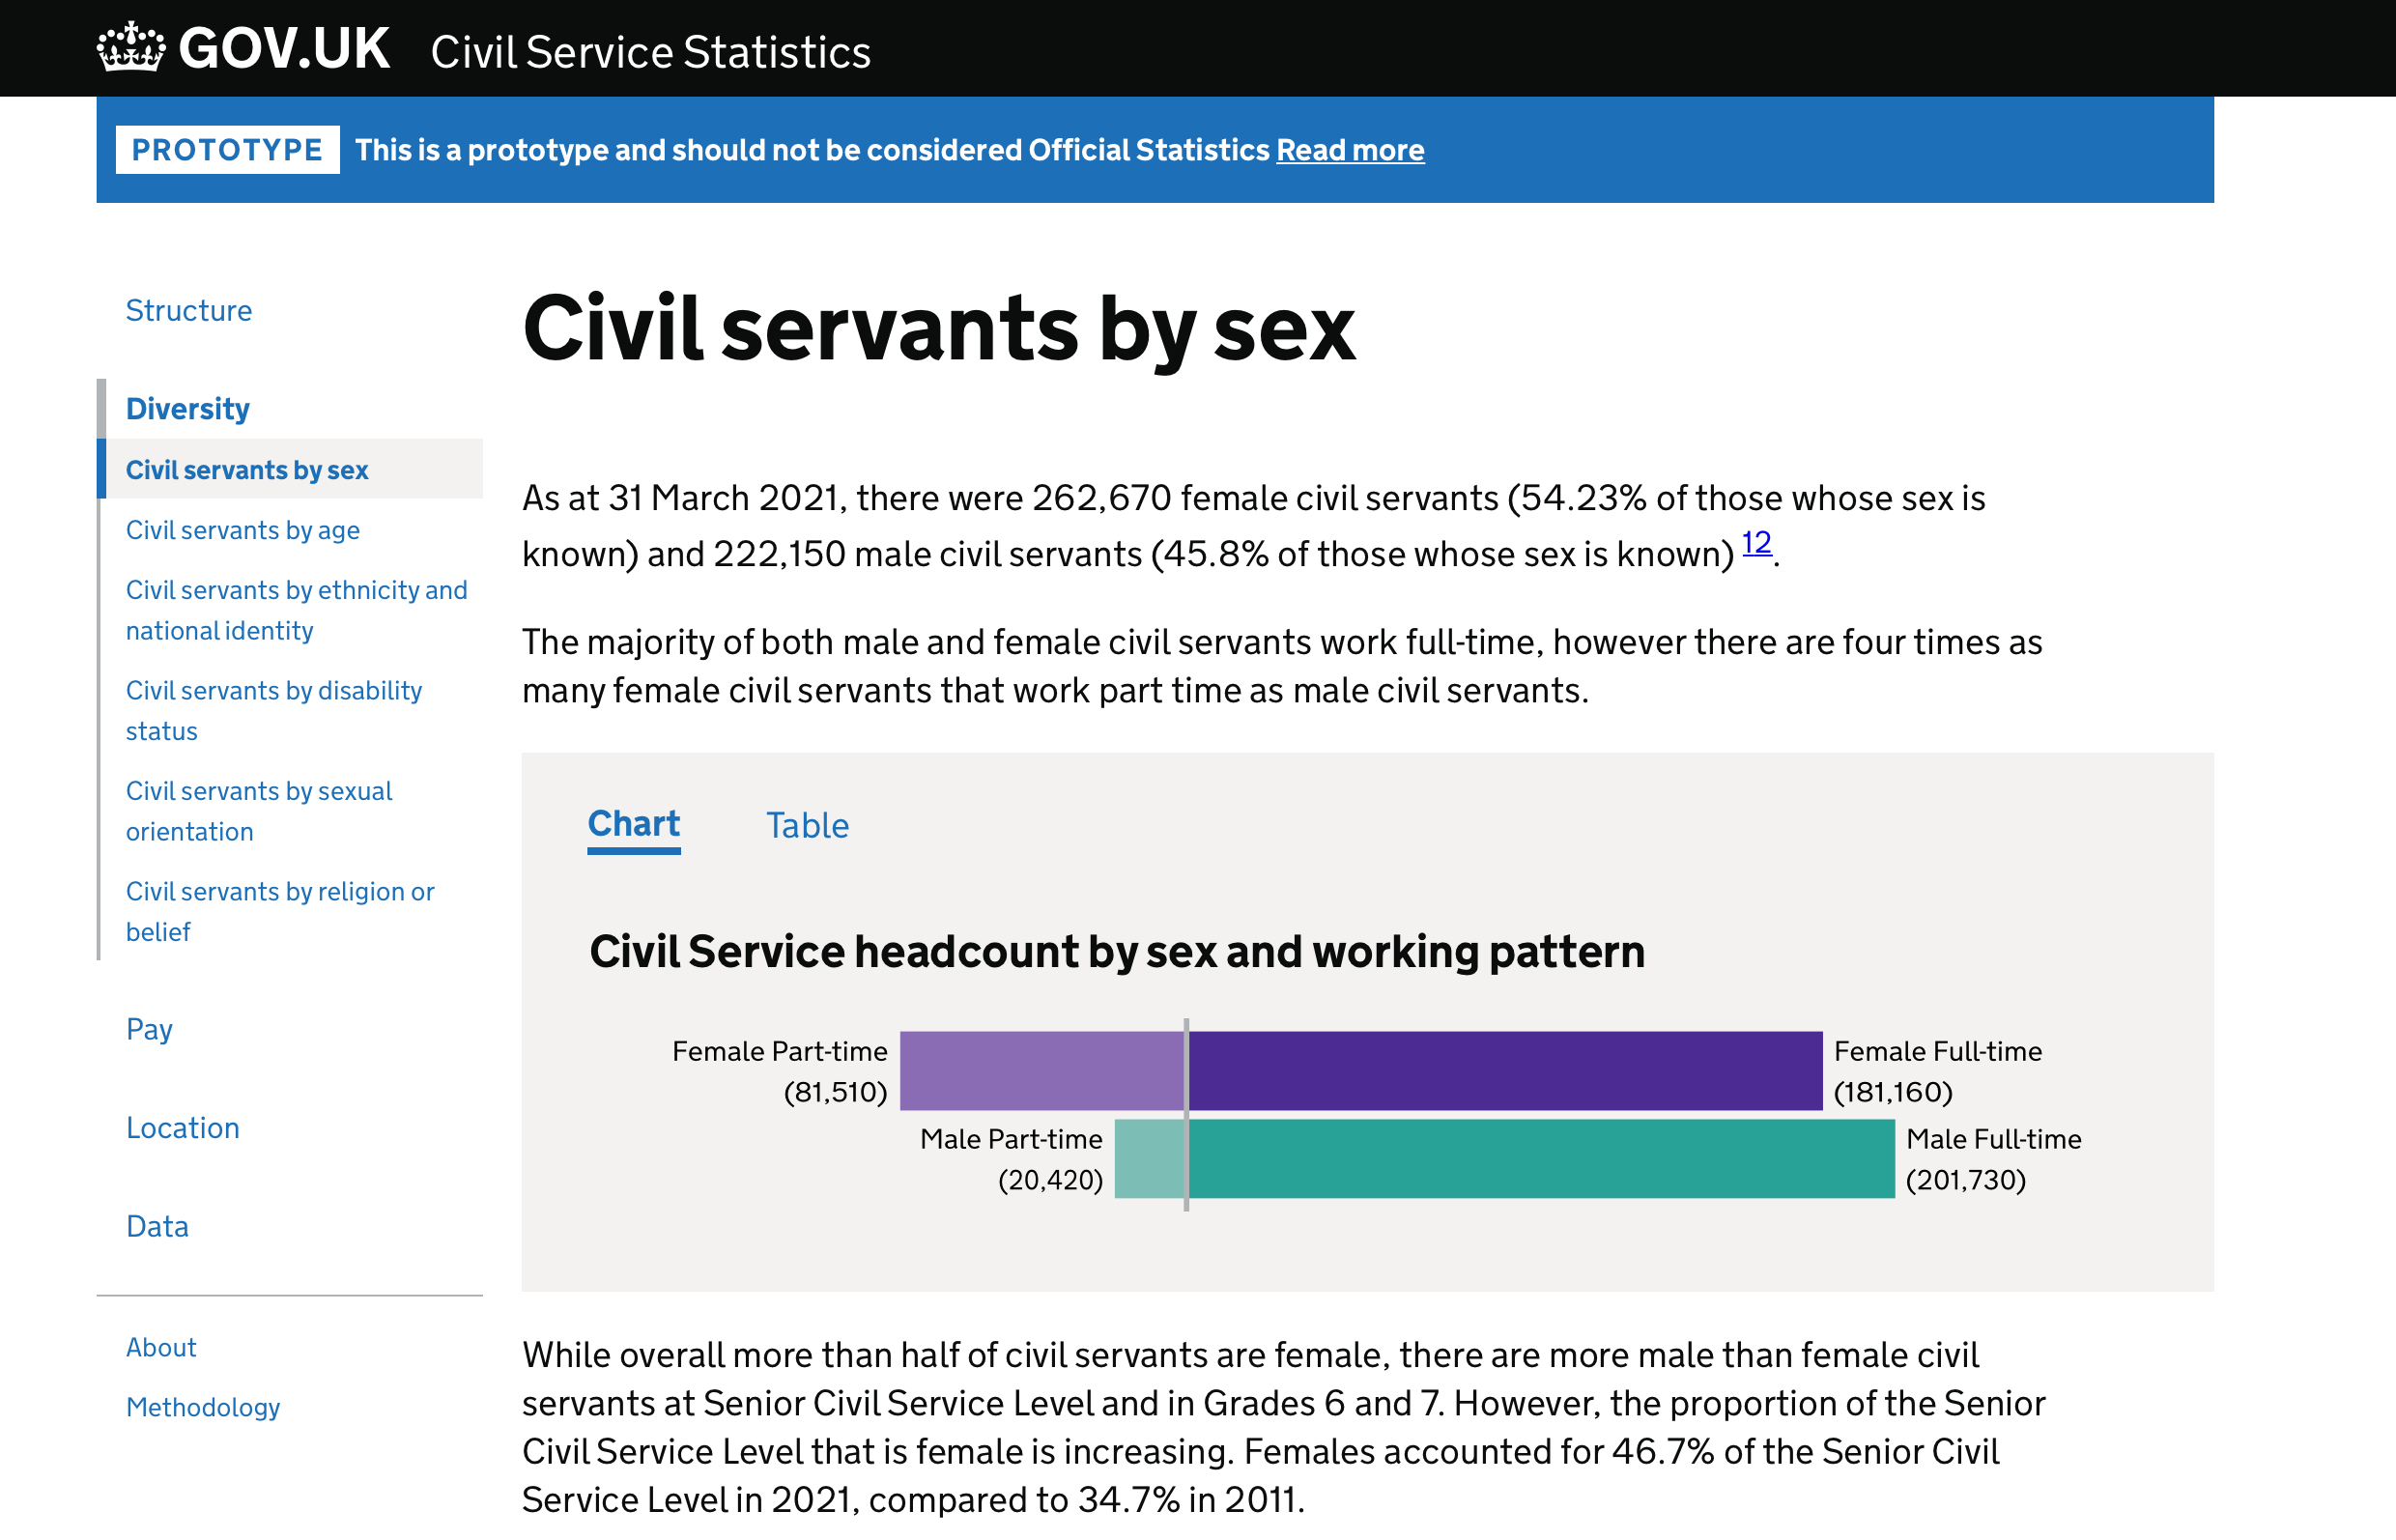
Screenshot of the govukhugo prototype for Civil Service Statistics
There was also interest from other parts of government in potentially using
govukhugo, but I’m unaware of anyone actually doing so. When I left the
Cabinet Office my role was not replaced and none of the teams in my division
had sufficient resource capacity to pick up the prototypes and develop them
further into full products11.
Sixteen going on seventeen… what next?
I still believe that govukhugo is a useful and valuable project for
government analysts. So some reflections and thoughts on what next for the
project.
Few teams have the ability to hire the web developers, data architects, software engineers, business analysts, user researchers and others that are necessary to build and maintain a successful service like the Coronavirus dashboard; and in most cases this would also be overkill. The Covid-19 pandemic has been an unprecedented event in many respects, but the need for near real-time quantitative data not only for government decision makers but for the whole of society is unlikely to be matched except by another pandemic.
There are however many analysts across government who can see the benefit in better presentation and publication of their data, for internal and external users. Yet despite the growth of data journalism outside of government, and the increased availability of methods for producing web content and interactive output from the R and Python ecosystems12, the vast majority of government statistics are published as spreadsheets13 with an HTML or PDF bulletin of long-form text14.
I would argue that given the available technologies we should be expecting
more from government when it is publishing statistics, and thus govukhugo is
potentially a way support that.
But as mentioned above I don’t think govukhugo is in a finished state, and
it will always need maintenance to keep up to date with the regular patches and
updates to GOV.UK Frontend (the code the puts the design system into practice).
That leads me to two sets of considerations, first what needs to be done to get
it to a “finished” state and second how to achieve that.
Getting govukhugo in order
I used “finished” elsewhere in this post, by this I mean where it can be used easily by others and where activity of the core project is mainly maintenance rather than development. Broadly I think the following is needed:
- support for Quarto15 needs to be explored and implemented, which I’ll discuss a bit further;
- how support for Quarto might require changes to the associated R package, and what package/library support might be needed for working with the other computation engines Quarto supports16;
- update to the latest version of GOV.UK Frontend17, and consider
adaptations to the
govukhugoCSS to account for the introduction of the pagination and summary card components in v4.5.0; - user research to assess and inform the development of the specific design
choices made by
govukhugo; - accessibility testing — throughout the development of
govukhugoI have made use of various automated and developer tools for checking compliance with accessibility standards, but there is a need for a more comprehensive testing, especially with regard to R/Quarto widgets.
Something to consider much, much later down the line is whether to support WebR and Shiny for Python that enable client-side code processing could significantly improve interactivity in otherwise “static” web environments without the need for a web server.
Support for Quarto
In theory, getting govukhugo to work with Quarto should be relatively
simple, as Quarto explicitly supports
output for Hugo. I’ve not
tested it but the actual Hugo theme for govukhugo should in theory work ok
with Quarto, especially if not doing anything code related. However, there are
some cautions if working with code.
Quarto uses Hugo’s
page bundles
approach which I’ve not used with
govukhugo so far, and the {govukhugo} R package is not presently designed
to support this approach. There is also a need to think about how Quarto works
with dependencies, one of the issues encountered when initially developing
govukhugo was the interaction of the GOV.UK design system and the JavaScript
and CSS libraries introduced by interactive widgets. To manage this the
the {govukhugo} R package purposefully hijacks the rendering of R Markdown
documents into HTML to strip out the dependencies injected during the rendering
process and instead supports specific versions of the the libraries in the core
theme.
I’m definitely convinced migrating to page bundles is the right approach18. But, I’m minded to continue to recommend separating dependency management to minimise unintended interactions with the GOV.UK Design System. However, this requires further work to investigate how Quarto processes dependencies and what (if any) bespoke code needs generating.
How to get there
So there’s some work to do for further development of govukhugo but how to
go about doing it?
govukhugowas developed as a single person side-of-desk effort, since I left government there has been nobody to take over development and maintenance of the project.- As outlined in the previous section there is still some core development
activity that needs to be undertaken in order to get
govukhugointo a stable place, even within the R ecosystem. - The GOV.UK design system is regularly maintained and updated so there needs to be an ongoing commitment to its maintenance.
As I’ve already said, I do still believe in the value and purpose of the work,
and I think the launching of Quarto gives more opportunity for analysts in
government to consider using govukhugo. But… there’s a few fundamental
issues that have meant I’ve not done any further development work on the
project so far:
- As I’m no longer in government I don’t have ready access to the intended user community — whether to promote the work; seek feedback/testing; or, perhaps most importantly stay up to date on the latest developments in the Analysis Function.
- The project ideally needs to be more than a single person effort and have clear institutional support so that there isn’t a single point of failure.
- The current repo for
govukhugosits within the Cabinet Office Analysis & Insight team’s Github organisation, so any development work likely needs to be in an independent fork19. - I’d be happy to continue to progress the work… but in the immortal words of Destiny’s Child, “bills, bills, bills”20, and the workload involved is non-trivial so it’s not something I’m going to do for free.
Do-Re-Mi… TLDR
This post has gotten a bit long, so a brief summary:
govukhugowas developed as a successor for{govdown}, while a companion R package was developed there’s nothing to stop it from being used with Python or other tools that generate markdown/HTML.- I’ve not tested it with Quarto, but again in theory it should work, though there may be complications in how to handle dependencies.
- The Analysis Function in government is not organised to handle projects like this where there the benefit is spread across departments, and relies too much on the good work of a specific individual and that individual staying “in the system”.
-
Apologies for the few (but terrible) puns using song titles and lyrics from The Sound of Music. ↩︎
-
GOV.UK was developed largely for the purpose of replacing a large number of websites providing information and transactional services to the public and businesses. As a result the design system’s main layouts and components are tailored towards the presentation of long-form text (e.g. news releases, policy papers, guidance documents) and forms (e.g. applications for licenses, provision of tax returns and information for regulatory compliance), it was not designed with the presentation of data and statistics in mind. The GOV.UK design system does not support specialist components for data-heavy needs. For example most charts in GOV.UK documents are included as static raster images rather than with accessible web technologies such as SVG, and data tables cannot be sorted. ↩︎
-
The
govukhugotheme supports most styles and components, it also includes some custom shortcodes to support dashboard specific requirements. In theory shortcodes could also be developed for the GOV.UK design system’s standard patterns. Hugo’s shortcodes are also easier to develop and maintain as they are largely written in HTML, with only a small reliance on Go compared to the system of Lua filters required when using Pandoc to covert RMarkdown to HTML. ↩︎ -
Most notably there is a predisposition/heavy reliance in both RMarkdown and
{htmlwidgets}to rely on the Bootstrap CSS & Javascript framework for web design, which is not compatible with the GOV.UK design system. ↩︎ -
While RMarkdown allows you to specify an SVG device output for plot chunks, there are still accessibility issues regarding the HTML elements used and inclusion of alt text. The
{govukhugo}package resolves this by providing a function that inserts SVG code into the resulting HTML document that embeds alt text appropriately. Whereas RMarkdown inserts SVG content as a base64 encoded data for an HTML<img>tag, while this allows the image to scale it means any text embedded in the image (a very common aspect of chart images) cannot be easily selected by users or read by screen readers. ↩︎ -
Originally this blog used the Terminal theme developed by Radek Kozieł, which I then customised for example to create a shortcode for an in-post table of contents and to add the reading time of a post to the blog list pages. I replaced Terminal with a theme of my own design in summer 2022. ↩︎
-
These are projects I’d initially pitched in late 2019 and early 2020 using
{govdown}, and how I tested the limits of that package. However, while my main project from 2017-2019 had come to a natural low point and despite supporting my wider set of policy customers, none of these projects were seen as a priority. Instead, I spent the summer of 2020 helping the Cabinet Office’s central finance and strategy teams reproduce some very shoddy analysis commissioned from McKinsey as part of a “zero-based review” of the department. And, because their methodology had been how the first round of the zero-based review had been conducted had to be kept for the subsequent rounds; despite me pointing out its multiple flaws, the need for excessive caveats, or that I could refine the methodology to improve its accuracy and utility with minimal effort. ↩︎ -
This became significant factor in my decision to leave my role at the Cabinet Office. ↩︎
-
A key reason for these latter two examples was that a lack of good quality and easy to use publications of the People Survey and Civil Service Statistics leads not only external parties but many people internal to the Civil Service relying on the work done by the Institute for Government (IfG). This isn’t to do down the work of the IfG, indeed they have been important counterparts on several projects in my time and they do good work in analysing how government works. But it shouldn’t be the case that in order to understand the structure of the Civil Service, the pay of civil servants, the results of the People Survey that senior leaders have to go to an external party for visualisations and analysis of data that the Civil Service collects and published about itself. ↩︎
-
The last commit to the
@co-analysis/govukhugorepo was on the 13th July 2022. ↩︎ -
Let’s mention Observable and Julia here, even though they’re much less used in government; but I’m specifically not counting PowerBI or Tableau here. ↩︎
-
Spreadsheets are both the best and the worst tools for analysis and data publication. While there has been good work in developing guidance for publishing data via spreadsheets, it’s a sticking plaster for the fact that the spreadsheet is a near-ubiquitous everything-for-everyone tool rather than a the best tool for anything. Moreover the OpenDocument Spreadsheet (ODS) format that is recommended for government publications is truly hideous and not well supported. ↩︎
-
Thankfully there has been a move towards publishing bulletins as HTML on GOV.UK (via Whitehall Publisher) rather than PDF, but charts in these are still largely static and JPEG/PNG images. The ONS has arguably done the best in terms of migrating from PDF to HTML, but is helped by the fact its website is separate from GOV.UK and therefore has been built with data journalism and interactive data content in mind. ↩︎
-
Quarto is the next generation successor to RMarkdown, and has support for Python, Observable and Julia built-in. It has been developed by Posit, PBC (formerly RStudio) with an explicit intention to support multiple languages and IDEs. This presents a great opportunity for
govukhugoto be used more easily in analytical teams that are Python based, or where Observable might provide better visualisations. ↩︎ -
From some recent experiences I think there should be wider consideration from government analysts in using Observable, especially if working with Quarto. It is developed by the creator of the D3 graphics library and has some very powerful features for data visualisation. ↩︎
-
The recommended advice is to install GOV.UK Frontend via npm, however avoid the need for analysts to install additional software, especially software (such as node) that might be blocked by system administrators,
govukhugorelies on the method of using the pre-computed files released on the GOV.UK Frontend Github repo. ↩︎ -
In developing my personal portfolio site I have used the page bundles approach to working with Hugo and found it to be very easy to work with especially for content management such as images. ↩︎
-
The work is released under the MIT License so can be easily lifted for further development to happen elsewhere. ↩︎
-
You got this far, reward yourself with this end of the 20th century classic.
Yes, that’s right, this song was released in 1999… Surely not… Yup, it was released in the UK on 12 July 1999. Given that I’ve made some terrible Sound of Music puns I should also give you something from that too. ↩︎