Posts tagged: ggplot2
2021-01-17Making aRt
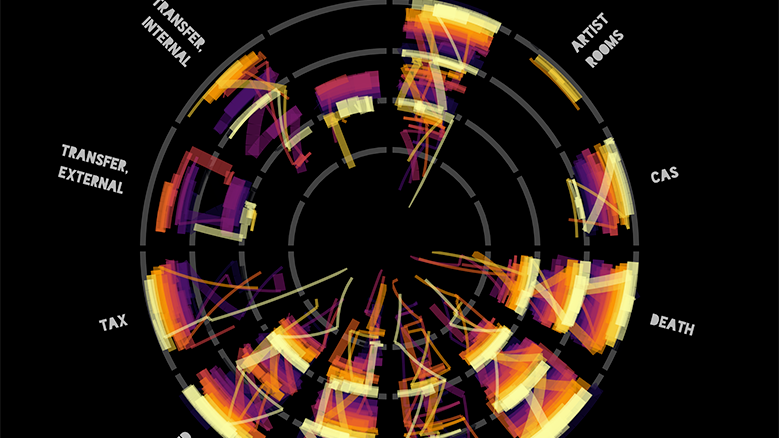
One of my 2021 resolutions was to engage with Tidy Tuesday more often. I’ve dabbled in the past but never recorded my work or published it. This week’s data was a catalogue of the Tate collection, and there have been some rather fantastic visualisations1, no doubt inspired by the fact the subject matter is art.
The other week I saw a tweet by Ijeamaka Anyene showcasing some fabulous artistic plots made in R by using the coord_polar() function within {ggplot2}.
2020-06-26The interplanetary birthday express
Hello Humans, we cake in peace. We here at the Interplanetary Cake Union have noticed that you are missing out on the opportunity of celebrating your birthday more often by not knowing about your birthdays on other planets, and thus are potentially depriving yourself of more cake eating opportunities. Please use our birthday planets tool to review your age on other planets in the solar system, when your next birthday is and then use our Interplanetary Birthday Express service to order yourself a galactic collection of cake1.
2020-05-25The Tidyvision Song Contest: Part Deux
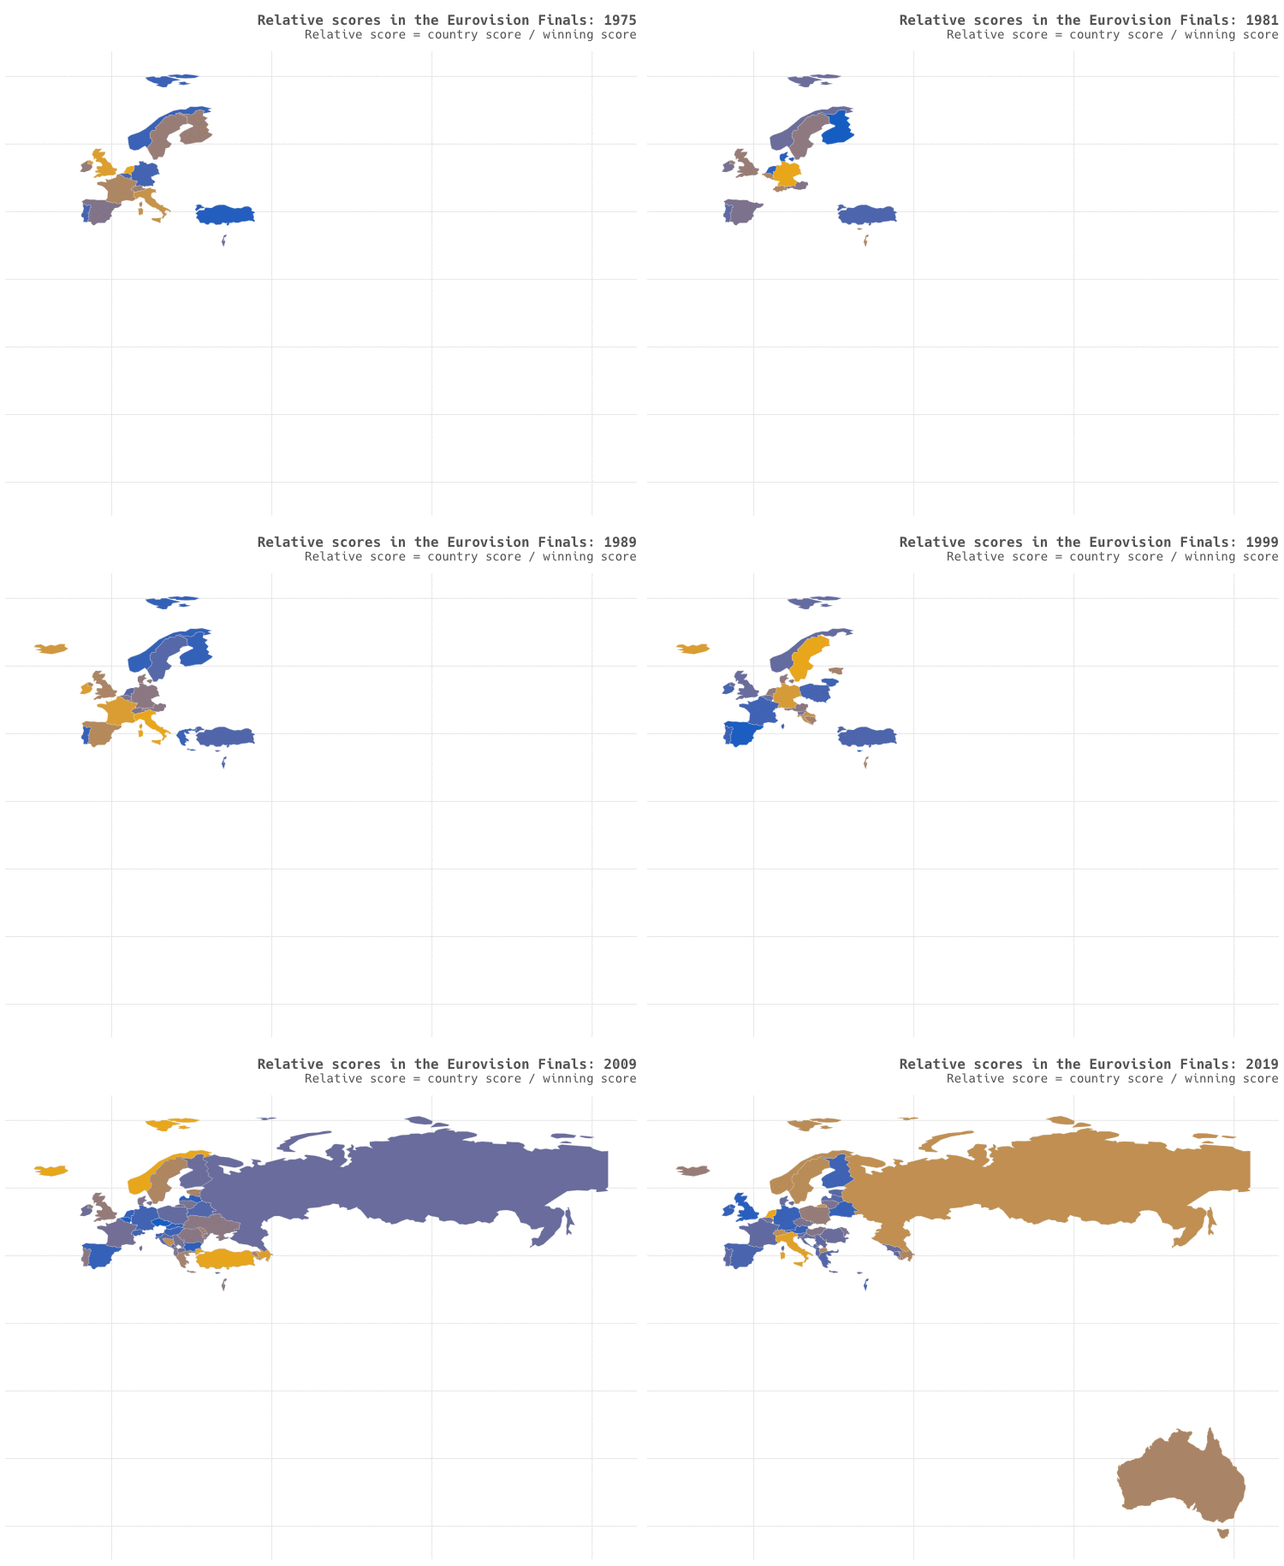
My last post explored using the {tidymodels} package with data about the Eurovision Song Contest1. One of the best things to do when exploring a dataset is to visualise it, so let’s also use this dataset to learn about the {gganimate} package that provides ways to create animated charts.
We’ll reuse the eurovision_scores dataset produced from the code in my last post. First let’s take a look at UK performance over time, we also need to filter out data from 1991 where Sweden and France both gained 146 points (but due to the complex rules in place at the time Sweden won, however under the current rules France would have won).


